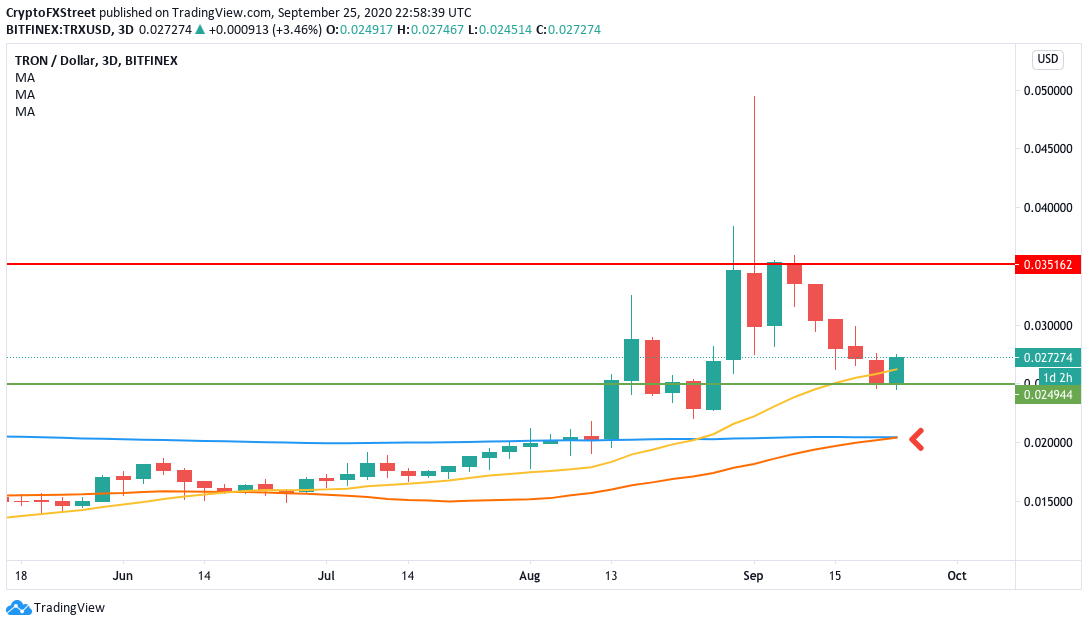
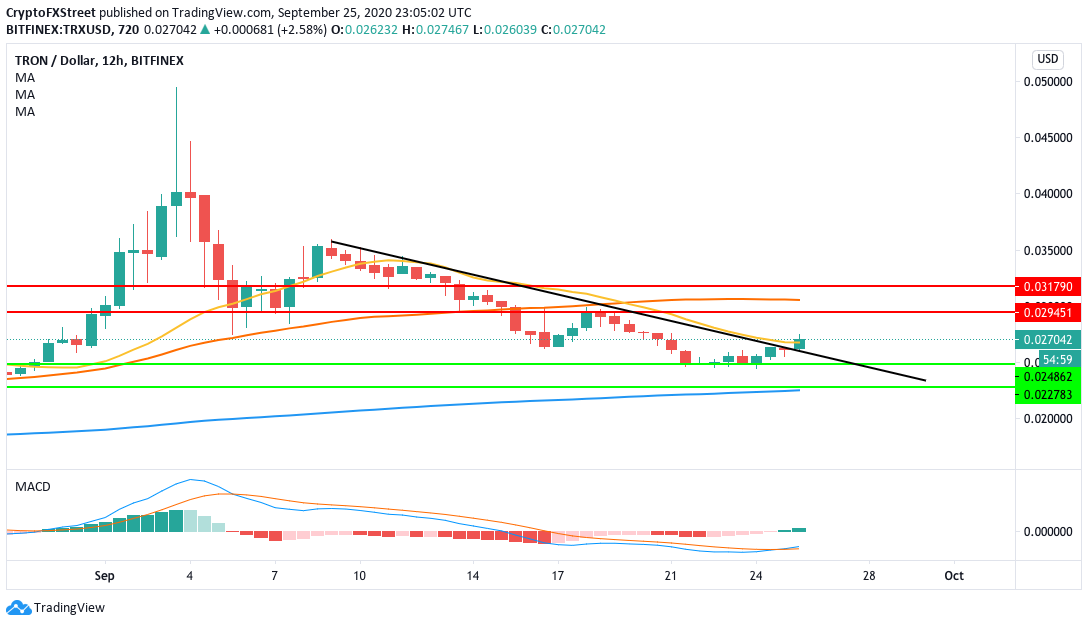
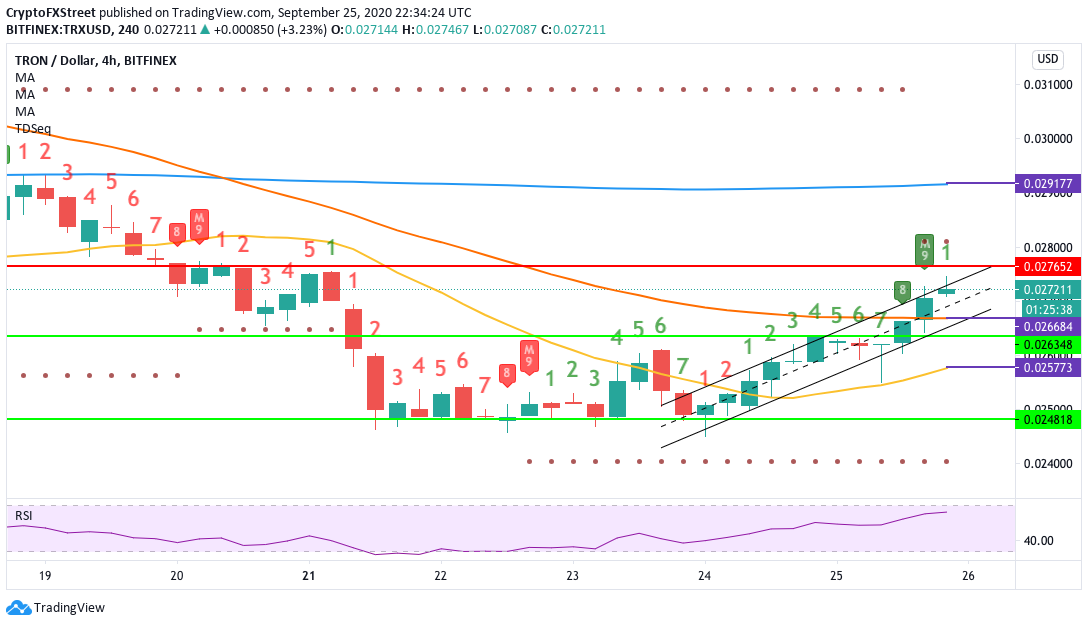
TRX/USD 3-day chart has formed the bullish golden cross pattern. The 12-hour chart MACD has reversed from bearish to bullish. Tron’s 3-day chart has had a bullish session after five straight red sessions. However, there is one more sign that shows that this isn’t a one-time occurrence. TRX/USD 3-day chart The SMA 50 has touched the SMA 200 and is about to completely cross over to chart the heavily bullish golden cross pattern. This means that more bullish growth is expected. However, how much is the upside potential? Let’s check out some smaller time frames. TRX/USD 12-hour chart TRX/USD has had a bullish breakout from the descending triangle formation. In the process, it seems to have broken above the SMA 20 curve. The MACD has shifted market momentum from bearish to bullish. Ideally speaking, the price will want to break above the $0.02945 resistance level to make the most out of this bullish momentum. However, does the price have what it takes to actually break past these levels? For that, let’s constrict our timeframe some more. TRX/USD 4-hour chart TRX/USD has flashed the TD sequential sell signal and is trending in a flag formation. If the buyers somehow manage to reverse the trend, the RSI will creep into the overbought zone, which will usher in a bearish correction anyway. However, if the price does experience a bearish correction in the short-term, the SMA 50 curve must hold firm to prevent further downtrend. So, while the price may face a short-term bearish correction to $0.0264, the long-term outlook still looks positive. FX Street FX Street FXStreet is the leading independent portal dedicated to the Foreign Exchange (Forex) market. It was launched in 2000 and the portal has always been proud of their unyielding commitment to provide objective and unbiased information, to enable their users to take better and more confident decisions. View All Post By FX Street Crypto News share Read Next Bitcoin Price Forecast: BTC sandwiched between strong resistance and support levels FX Street 2 years TRX/USD 3-day chart has formed the bullish golden cross pattern. The 12-hour chart MACD has reversed from bearish to bullish. Tron’s 3-day chart has had a bullish session after five straight red sessions. However, there is one more sign that shows that this isn’t a one-time occurrence. TRX/USD 3-day chart The SMA 50 has touched the SMA 200 and is about to completely cross over to chart the heavily bullish golden cross pattern. This means that more bullish growth is expected. However, how much is the upside potential? Let’s check out some smaller time frames. TRX/USD 12-hour chart TRX/USD has… Regulated Forex Brokers All Brokers Sponsored Brokers Broker Benefits Min Deposit Score Visit Broker 1 $100T&Cs Apply 0% Commission and No stamp DutyRegulated by US,UK & International StockCopy Successfull Traders 9.8 Visit Site FreeBets Reviews$100Your capital is at risk. 2 T&Cs Apply 9.8 Visit Site FreeBets Reviews$100Your capital is at risk. 3 Recommended Broker $100T&Cs Apply No deposit or withdrawal feesTrade major forex pairs such as EUR/USD with leverage up to 30:1 and tight spreads of 0.9 pips Low $100 minimum deposit to open a trading account 9 Visit Site FreeBets ReviewsYour capital is at risk. 4 T&Cs Apply Visit Site FreeBets ReviewsYour capital is at risk. 5 Recommended Broker $0T&Cs Apply Trade gold, silver, and platinum directly against major currenciesUp to 1:500 leverage for forex trading24/5 customer service by phone and email 9 Visit Site FreeBets ReviewsYour capital is at risk.