- Uniswap price shows a breakout from a symmetrical triangle consolidation pattern.
- A decisive close above the breakout point at $23 signals a 45% upswing to $33.6.
- Transactional data shows a large presence of underwater UNI investors up to $25.05.
- A rejection in upswing up to this level could delay the bullish scenario.
Uniswap price has been among a few DeFi coins that have seen impressive gains during the recent bull run. At the time of writing, UNI is pushing past another critical level, hinting at a 45% bull rally soon.
Uniswap price prepares for a massive leg up
Uniswap price surged approximately 70% on February 20 and hit a local top at $33.23. Since then, the DeFi coin has been consolidating, forming lower highs and higher lows. By connecting these swing highs and swing lows using trendlines, a symmetrical triangle pattern forms. The target for this technical formation is determined by measuring the distance between pivot high and pivot low and adding it to the breakout point. The direction of a breakout for this setup isn’t set in stone and could go either way.
In this case, Uniswap price is breaching the triangle’s upper trendline at $23, which indicates a bullish breakout. Therefore, a 47% upswing puts UNI’s target at $33.6.
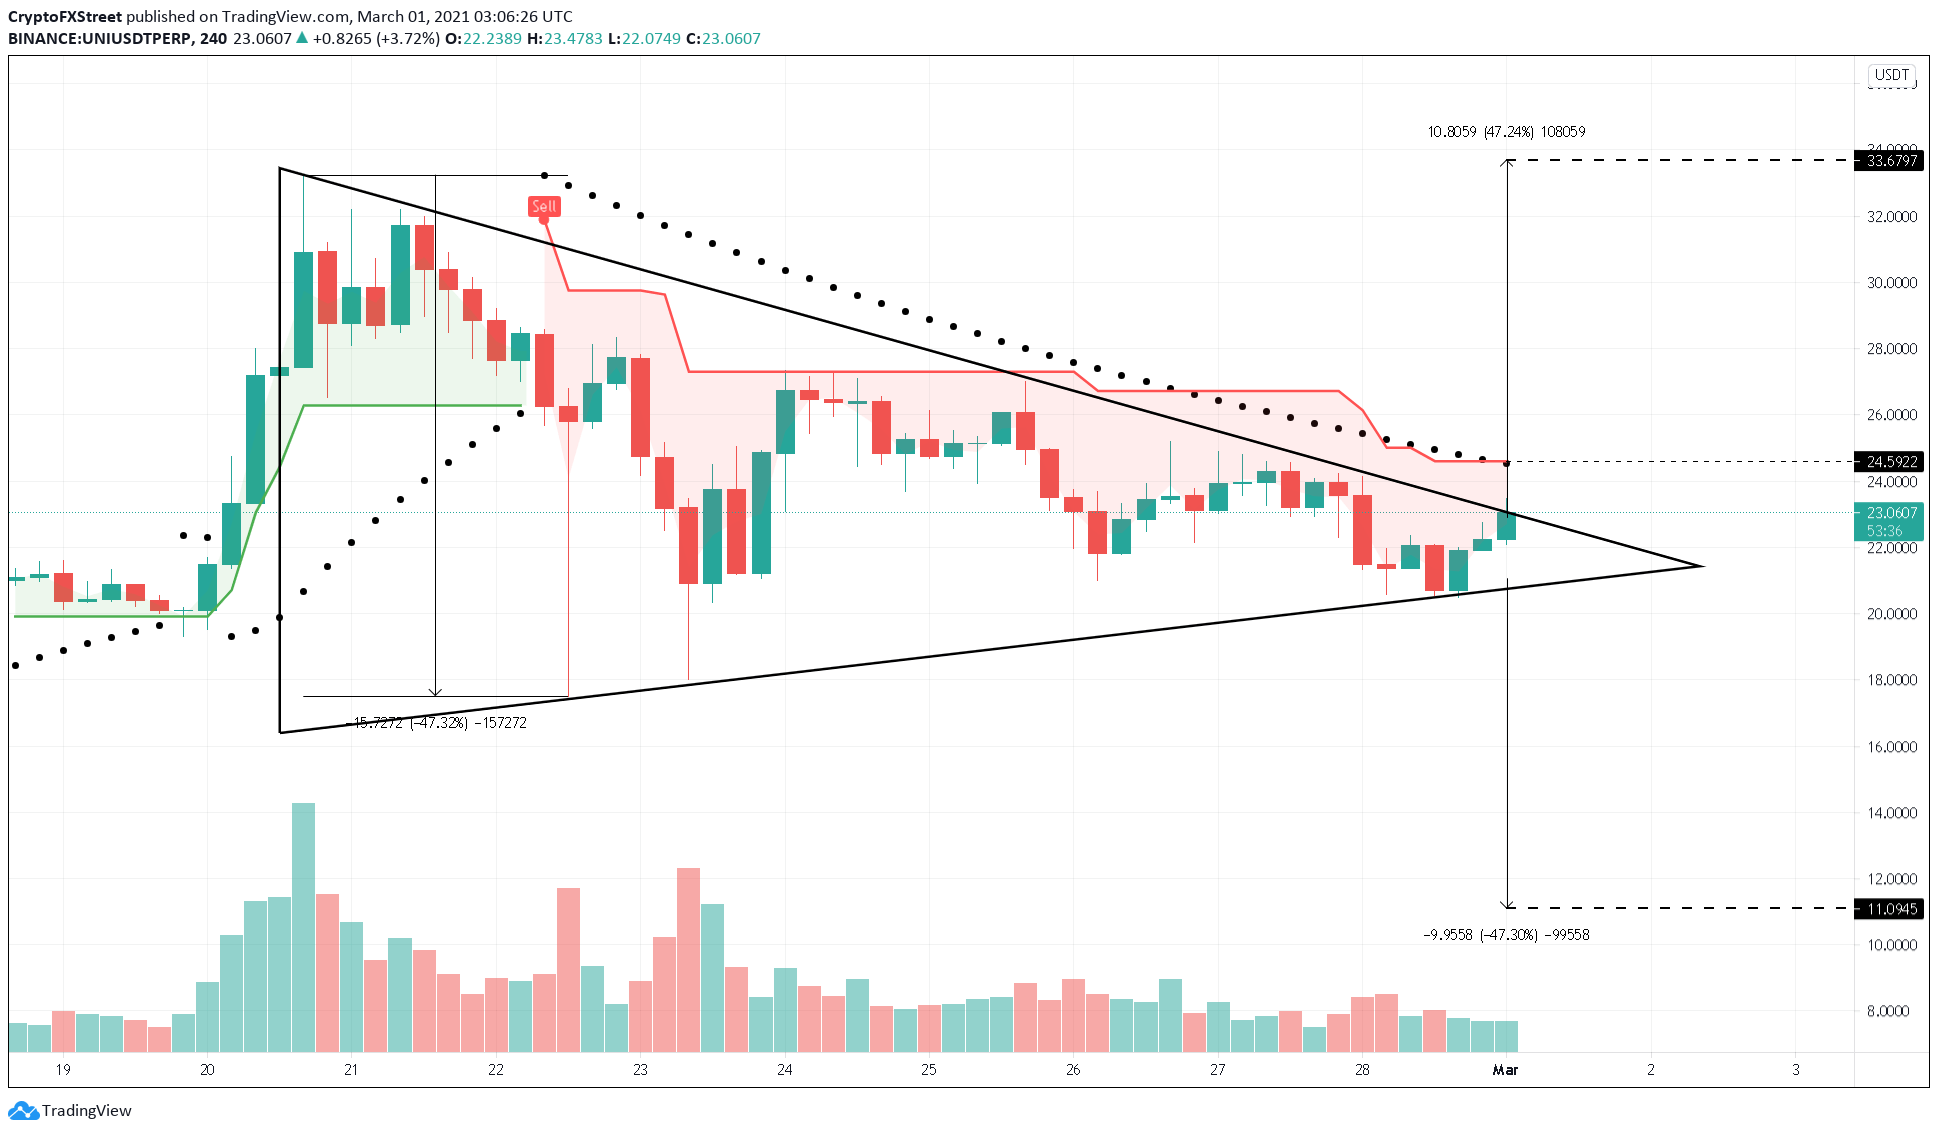
UNI/USDT 4-hour chart
Supporting the bullish thesis is IntotheBlock’s In/Out of the Money Around Price (IOMAP) model, which shows a stable support barrier at $21.30. Here roughly 8,200 addresses hold nearly 16.3 million UNI. IOMAP cohorts also reveal a cluster of “Out of the Money” buyers present from $23.41 to $25.05, where 5,000 addresses hold roughly 25 million UNI. Hence, a four-hour candlestick close above this level will confirm an upswing and propel Uniswap price to $33.6.
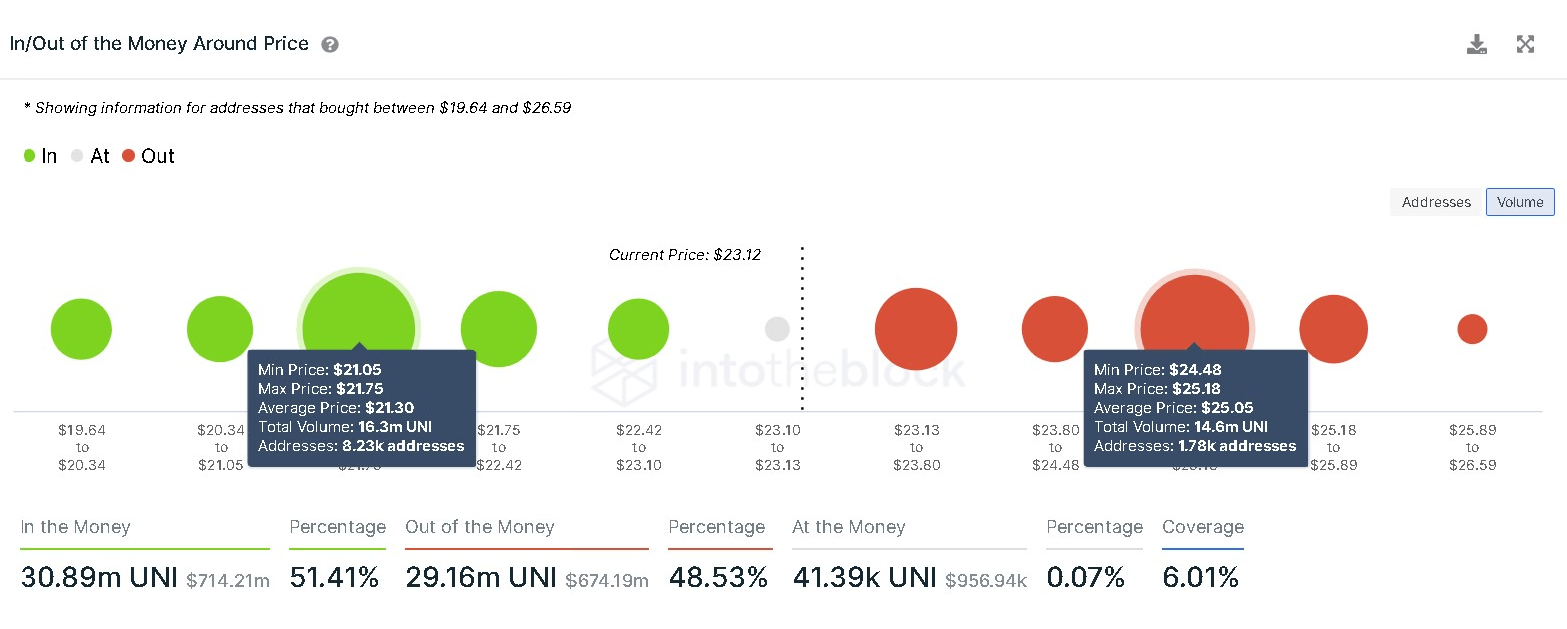
Uniswap IOMAP chart
On the flip side, Uniswap price could suffer a fatal setback if it fails to climb above $25.05. Adding credence to this bearish outlook is the sell signal from the SuperTrend and the Parabolic indicator that spans back to February 22.
So, a rejection leading to a four-hour candlestick close below $20.74 will invalidate the bullish thesis and result in a downswing to $11.
