- Uniswap is balancing at the edge of a stiff cliff while bears swing into action aiming for $2.5.
- The 200 SMA is in line to offer a cushion at $3.4 and prevent a sharp fall in the price.
Uniswap is striding on an uneven ground after a recent rejection at $3.8. Before, UNI had embraced support at $3.45, hence the short-lived recovery. Meanwhile, a correction that could potentially become massive is underway.
Uniswap is on the cusp of a symmetrical triangle breakdown
The decentralized finance token is trading within the confines of a symmetrical triangle. The pattern forms when the price creates a series of lower highs and another series of higher lows. Trendlines are used to connect the peaks and lows.
A breakout can occur either above or below the triangle, but it happens before the trendlines converge. At the time of writing, UNI is trading at $3.5. The immediate upside is capped by the 50 Simple Moving Average and the 100 SMA.
The token is about to dive under the lower trendline, which might result in a massive downswing to $0.25. Tentative support at the 200 SMA is likely to absorb some of the selling pressure, preventing Uniswap from spiraling sharply.
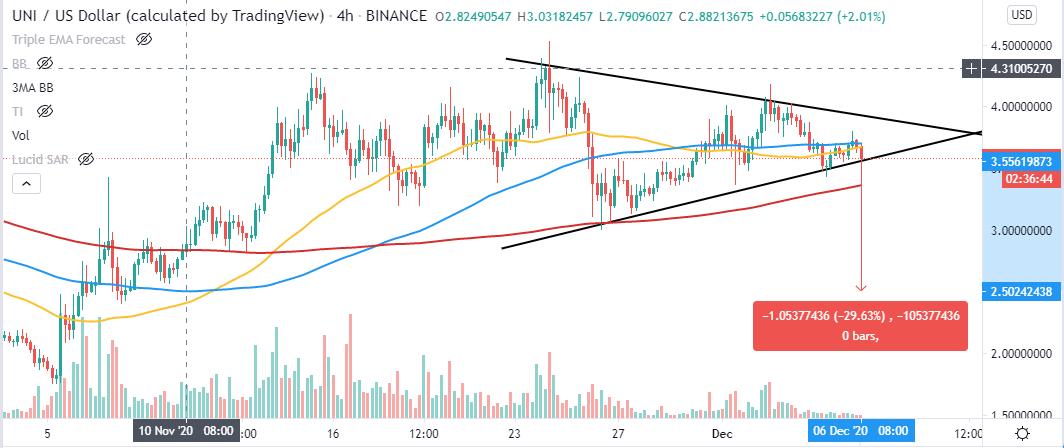
UNI/USD 4-hour chart
On the flip side, closing the day within the triangle might invalidate the bearish narrative. Moreover, a reversal above the hurdle created by the 50 SMA and 100 SMA would call for more buy orders. If the demand for Uniswap surges, a breakout above the triangle will culminate in a massive upswing to price levels beyond $5.
