- Uniswap charted a classic rising wedge breakdown on the 12H chart.
- On-chain metrics warrant caution for the UNI bulls.
- 100-SMA cushions the immediate downside.
Uniswap (UNI/USD) turns positive for the first time in five trading sessions this Saturday. The No. 30 coin attempts a bounce from two-week lows of $3.11, as the bears take a breather before the next push lower. At the press time, the price trades around $3.35, adding 2.50% over the 24 hours while on track for a 10% weekly loss.
-
Top 3 Gainers Of The Week Verge, Cardano, VeChain: Shrug-off the broad corrective trend
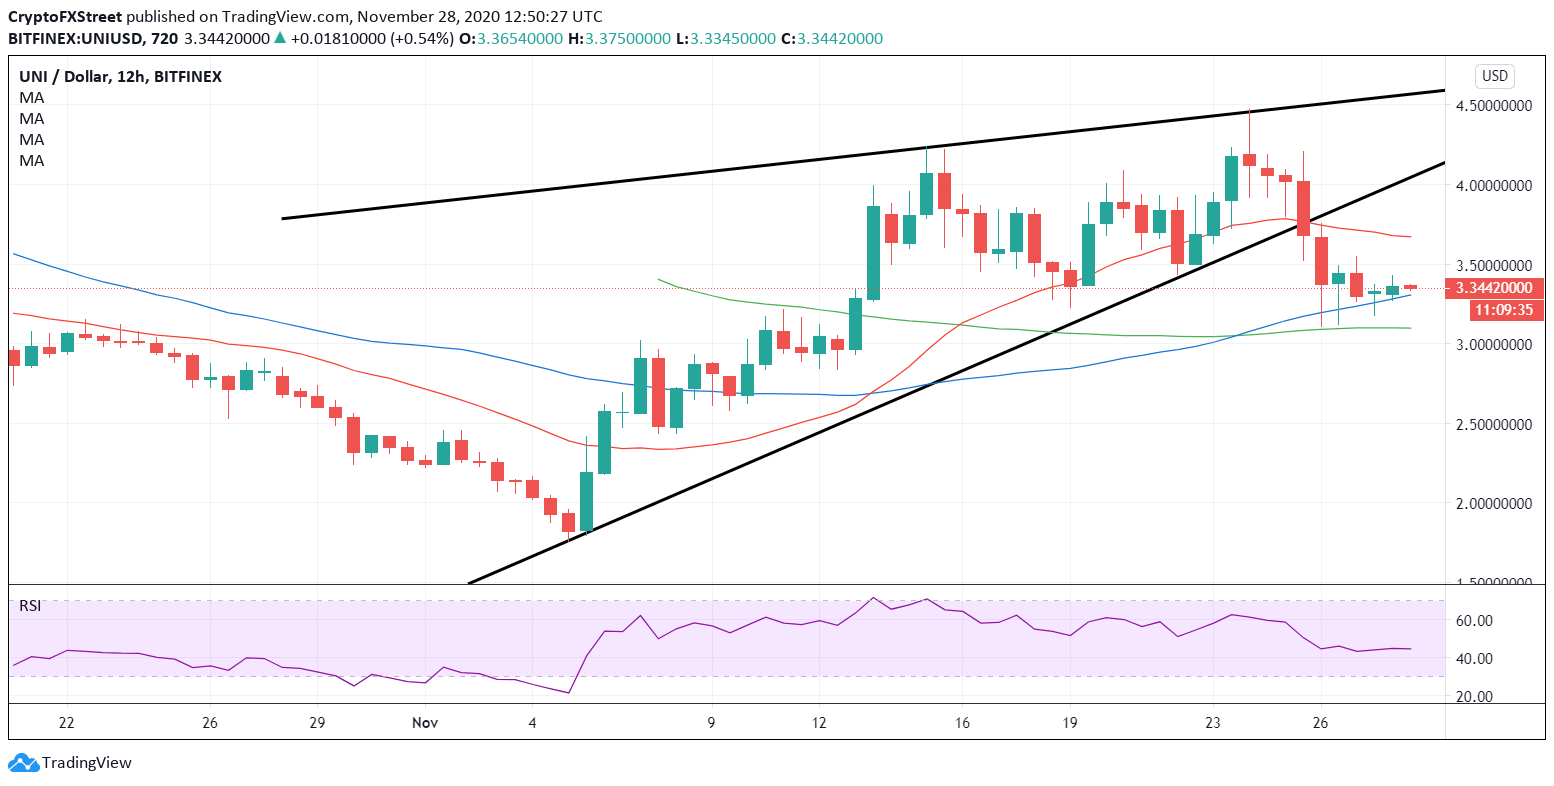
UNI/USD: 12-hour chart
As observed in the 12-hour (12H) chart, Uniswap has confirmed a classic rising wedge breakdown on Wednesday and since then it has been in a bearish consolidation phase.
The horizontal 100-simple moving average (SMA) at $3.10 has saved the day for the UNI bulls, for now, as the bearish Relative Strength Index (RSI) has recovered from the troughs and turned flat, currently at 45.83.
A breach of the 100-SMA support could intensify the selling pressure, exposing the measured pattern target at $1.068. Alternatively, acceptance above the bearish 21-SMA at $3.68 is critical to negate the near-term downside bias.
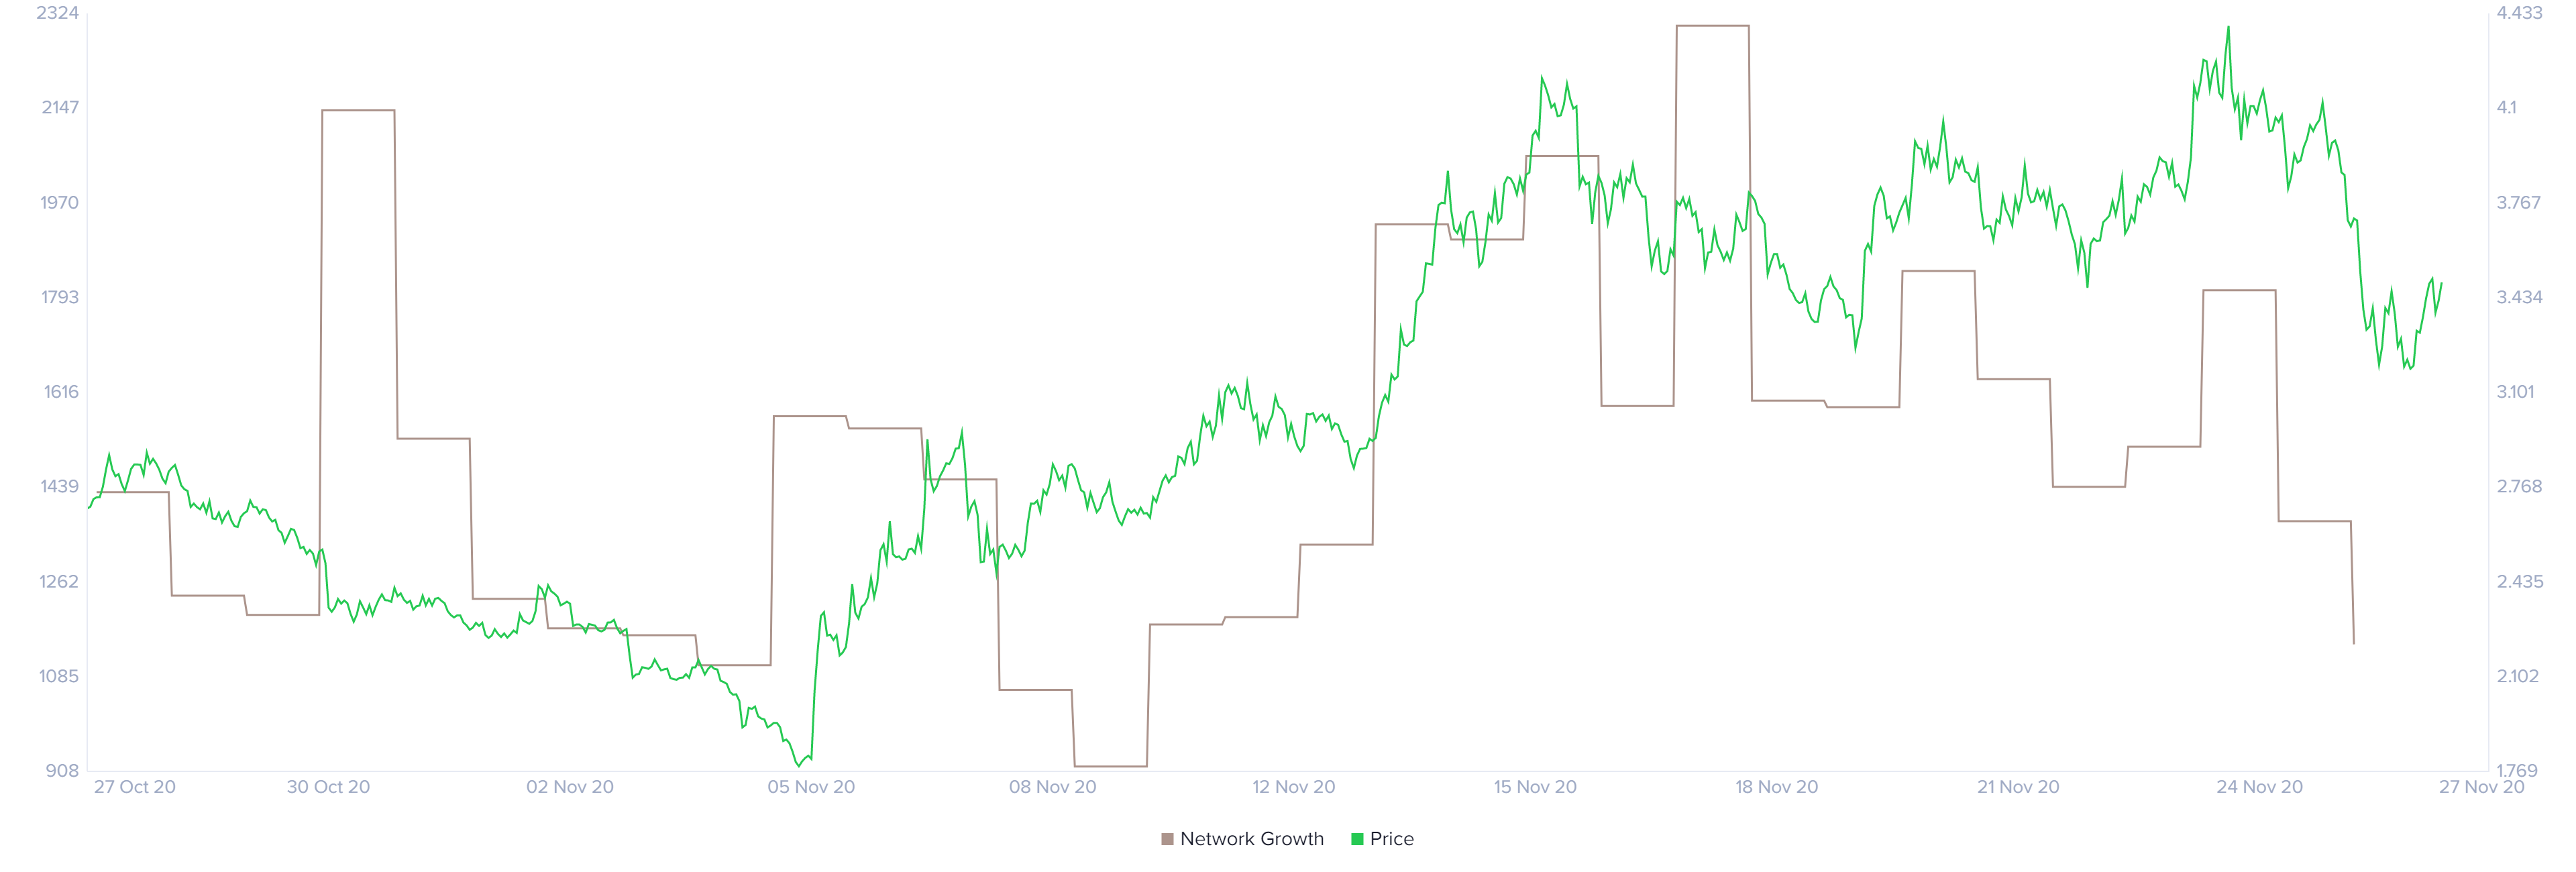
Despite the recovery attempt, the downside in Uniswap appears more compelling amid downbeat fundamentals, in the face of a slump in network growth, as indicated by Santiment, a leading provider of on-chain metrics.
“In the last seven days, the number of new addresses decreased significantly. The addresses topped 2,300 on November 17 but slumped to 1,146 by November 26, representing a 50% decline. The downtrend in network growth is a red flag for price growth in the short term,” FXStreet’s Cryptocurrencies News Editor John Isige explains.
