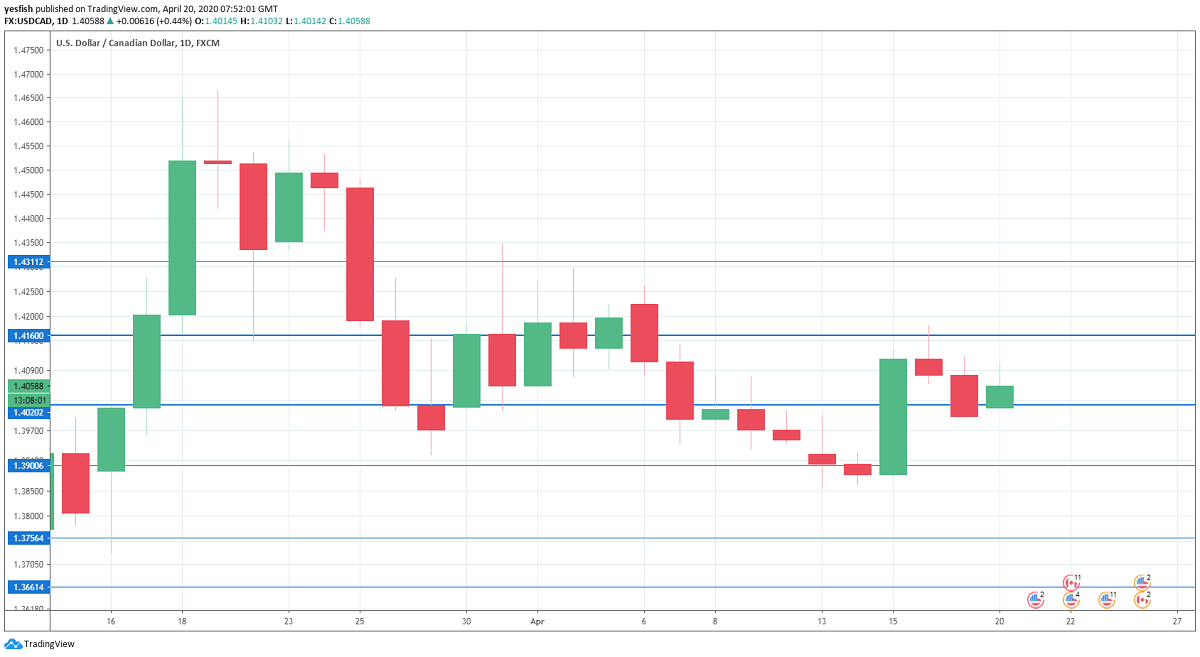
USD/CAD daily chart with support and resistance lines on it. Click to enlarge:
USD/CAD recorded small gains last week, as the pair closed just shy of the 1.40 line. There are three events in the upcoming week, including key inflation and retail sales data. Here is an outlook at the highlights and an updated technical analysis for USD/CAD.
The Bank of Canada maintained the benchmark rate at 0.25%, as expected. The bank has shaved off a whole percentage point since the first week of March. The ADP nonfarm payrolls pointed to a bleak employment picture, with a huge loss of 177 thousand in March.
In the U.S., consumer spending plunged in March. Retail sales declined by a staggering 8.7%, worse than the estimate of an 8.0 percent decline. The core reading fell by 4.5%, beating the forecast of 4.9 percent. The employment market remains in disarray, as employment claims topped the 5-million mark. On the manufacturing front, the Philly Manufacturing Index plunged to -56.6, compared to -12.7 a month earlier. This was weaker than the estimate of -30.0 points.
- Wholesale Sales: Monday, 12:30. This indicator is a leading indicator of consumer spending. In January, the indicator gained 1.8%, up from 0.9% a month earlier. This was its highest level since January 2017. However, analysts are projecting a decline of 0.2% in February.
- Retail Sales: Tuesday, 12:30. The headline figure accelerated to 0.4% in January, up from zero in the previous reading. Core retail sales fell by 0.1% in January, down from 0.5% in December. We now await the February release.
- Inflation: Wednesday, 12:30. Consumer inflation rose 0.4% in February, up from 0.3%, This marked its highest level since July. The core figure improved to 0.7%, up from 0.4% a month earlier. Will the upswing continue in the upcoming release?
USD/CAD Technical Analysis
Technical lines from top to bottom:
We start with resistance at 1.4310.
1.4159 (mentioned last week) has some breathing room in resistance.
1.4019 has switched to a resistance role after USD/CAD lost ground.
The round number of 1.39 is a weak support line. 1.3757 is next.
1.3660 is the final support level for now.
I remain bullish on USD/CAD
The outlook for the Canadian dollar is negative, as the economic fallout from COVID-19 has shut down much of the economic activity in Canada and the United States, its most important trading partner. Weak oil prices are also weighing on the Canadian dollar.
Further reading:
- EUR/USD forecast – for everything related to the euro.
- GBP/USD forecast – Pound/dollar projections.
- AUD/USD forecast – analysis for the Aussie dollar.
- USD/CAD forecast – Canadian dollar predictions.
- Forex+ weekly forecast – Outlook for the major events of the week.
Safe trading!
