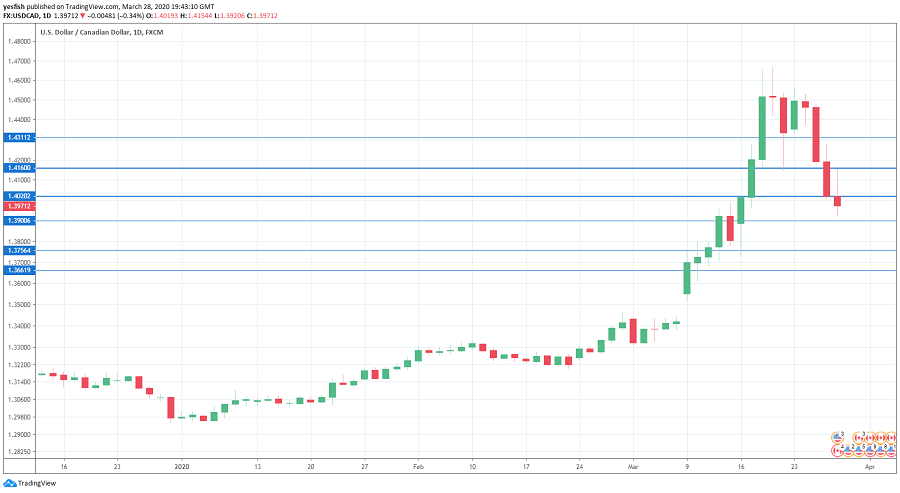
USD/CAD daily chart with support and resistance lines on it. Click to enlarge:
The Canadian dollar rebounded sharply last week, as USD/CAD declined by 2.5 percent. There are three events in the upcoming week, including GDP. Here is an outlook at the highlights and an updated technical analysis for USD/CAD.
The Bank of Canada took a page out of the Federal Reserve’s book and slashed rates on Friday at an emergency meeting. The BoC cut rates from 0.75% to 0.25%, saying that the move was needed to restore stability to the financial system and the economy. The bank also launched a Commercial Paper Purchase Program (CPPP) to inject short-term funding into the markets.
In the U.S., the highlight was a staggering figure for unemployment claims, which hit 3.2 million. This was due to the shutdown of many factories and businesses across the country. The ISM Manufacturing PMI dipped to 49.2 in March, down from 50.8 a month earlier. It marked the first contraction since August. Elsewhere, durable goods orders in February were a mix. The headline figure jumped 1.2%, up from -0.2% a month earlier. However, the core reading declined by 0.6%, compared to a gain of 0.9% in February. GDP for Q4 showed a 2.1% in the third estimate, confirming the previous estimate.
- GDP: Tuesday, 12:30. Canada releases GDP on a monthly basis. In December, the economy grew 0.3%, its best month since April. Will the upswing continue in January?
- Raw Materials Price Index: Tuesday, 12:30. The index was unexpectedly soft in January, posting a decline of 2.2%. This was well of the estimate of 2.1% and followed a strong gain of 2.8% in December. We now await the February data.
- Manufacturing PMI: Wednesday, 13:30. The PMI continues to produce readings above the 50-level, which separates expansion from contraction. In February, the index improved to 51.8, its best score since February 2019. Will the PMI remain in expansion territory in March?
USD/CAD Technical Analysis
Technical lines from top to bottom:
With USD/CAD sliding last week, we begin at lower levels:
1.4310 remains relevant as USD/CAD continues to show volatility.
1.4159 (mentioned last week) has switched back to a resistance role after USD/CAD dropped sharply last week.
1.4019 is a weak resistance line.
The round number of 1.39 is providing support.
1.3757 has held in support since mid-March.
1.3660 is the final support level for now.
I remain bullish on USD/CAD
The Canadian dollar rebounded last week, but it will have to continue to deal with rock-bottom oil prices and the economic bite from COVID-19. This will likely mean stormy waters are ahead for the minor currency.
Further reading:
- EUR/USD forecast – for everything related to the euro.
- GBP/USD forecast – Pound/dollar projections.
- AUD/USD forecast – analysis for the Aussie dollar.
- USD/CAD forecast – Canadian dollar predictions.
- Forex+ weekly forecast – Outlook for the major events of the week.
Safe trading!
