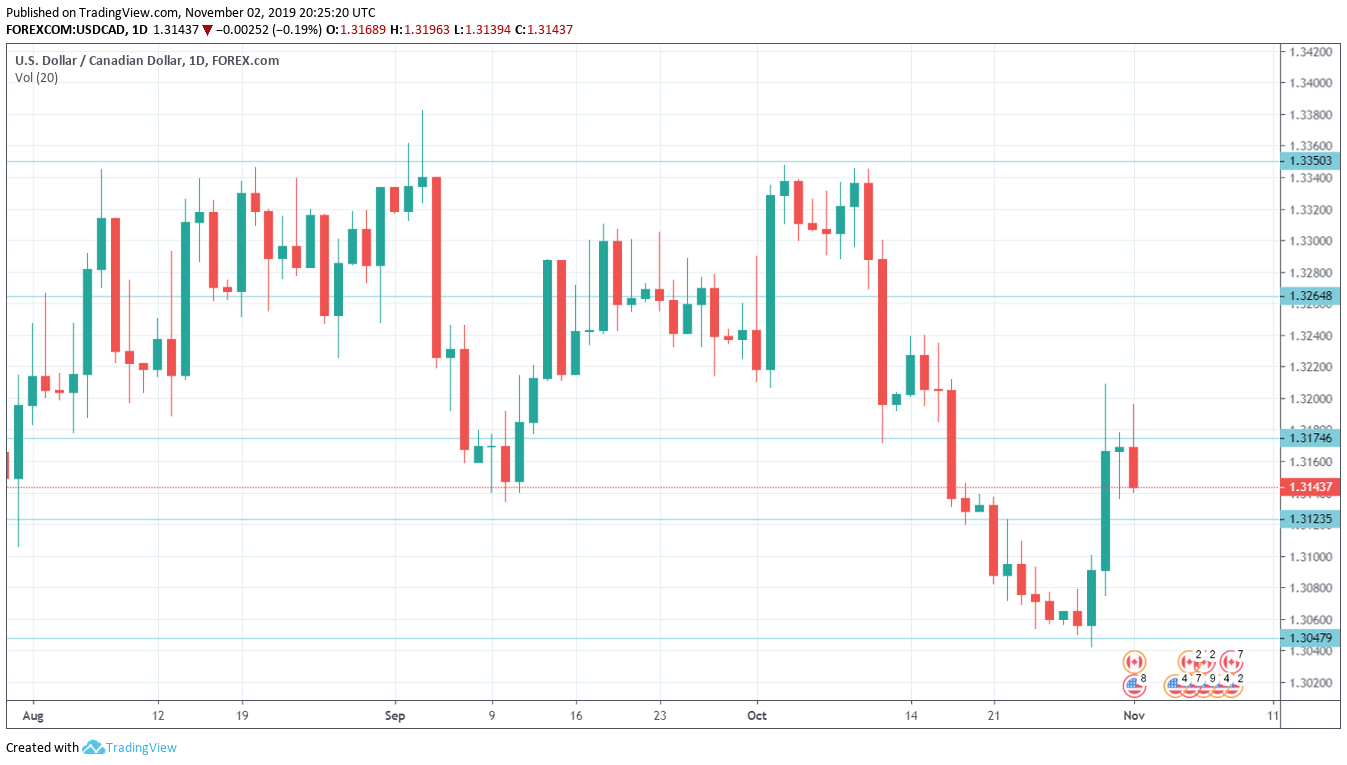
USD/CAD daily chart with support and resistance lines on it. Click to enlarge:
- Trade Balance: Tuesday, 13:30. Canada has posted two straight trade deficits. The deficit showed little change in August, with a reading of C$1.00 billion. Will we see another deficit in September?
- Ivey PMI: Wednesday, 15:00. The index dropped to 48.7 in September, done sharply from 60.6 a month earlier. This marked the first contraction since May 2016. Another weak reading is expected, with an estimate of 49.3 points.
- Employment Data: Friday, 13:30. The economy created 53.7 thousand jobs in September, pointing to a strong labor market. The unemployment rate dipped to 5.5%, marking a 4-month low. We will now receive the September numbers.
- Building Permits: Friday, 13:30. Building permits tends to show strong swings, which often results in forecasts that are off the mark. The indicator posted a strong gain of 6.1% in August, well above the estimate of 2.3%. We now await the September release.
USD/CAD Technical Analysis
Technical lines from top to bottom:
We start with resistance at 1.3445. This line has remained intact since the first week of June.
1.3350 has held since early September. 1.3265 is next.
1.3175 is an immediate resistance line.
1.3125 (mentioned last week) remains relevant and has switched to a support role.
1.3048 is protecting the round number of 1.3000, which has psychological significance.
1.2916 was last tested in October 2018.
1.2830 is next.
1.2730 is the final support line for now.
I am neutral on USD/CAD
Oil prices remain on the low side, which could weigh on the Canadian currency. At the same time, risk appetite has been steady, which is bullish for minor currencies like the Canadian dollar.
Further reading:
- EUR/USD forecast – for everything related to the euro.
- GBP/USD forecast – Pound/dollar predictions
- USD/JPY forecast – analysis for dollar/yen
- AUD/USD forecast – projections for the Aussie dollar.
- Forex+ weekly forecast – Outlook for the major events of the week.
Safe trading!