- The USD/JPY pair could register a larger upwards movement if it makes a valid breakout through the resistance area.
- The price continues to move sideways, so we’ll have to wait for a valid breakout from the current triangle.
- Stabilizing above the pivot point could signal further growth in the short term.
The USD/JPY price rebounded as the Dollar Index rose a little after Friday’s sell-off. Still, the price continues to move sideways in the short term, so we’ll have to wait for a fresh trading opportunity.
–Are you interested to learn more about ECN brokers? Check our detailed guide-
The Japanese Yen could take the lead again if the Nikkei and the Dollar Index drop deeper. Today, the Japanese Retail Sales reported a 2.4% growth in July versus 2.1% expected and after only 0.1% growth registered in June. The US Pending Home Sales registered a 1.8% drop in July. This could be bad for the US Dollar, USD/JPY could drop again after the current rebound.
Tomorrow, the Japanese Unemployment Rate, prelim Industrial Production, Consumer Confidence, and the Housing Starts will definitely impact the JPY. Also, the United States CB Consumer Confidence and the Chicago PMI could move the pair.
Nikkei (JP225) price technical analysis: False breakout
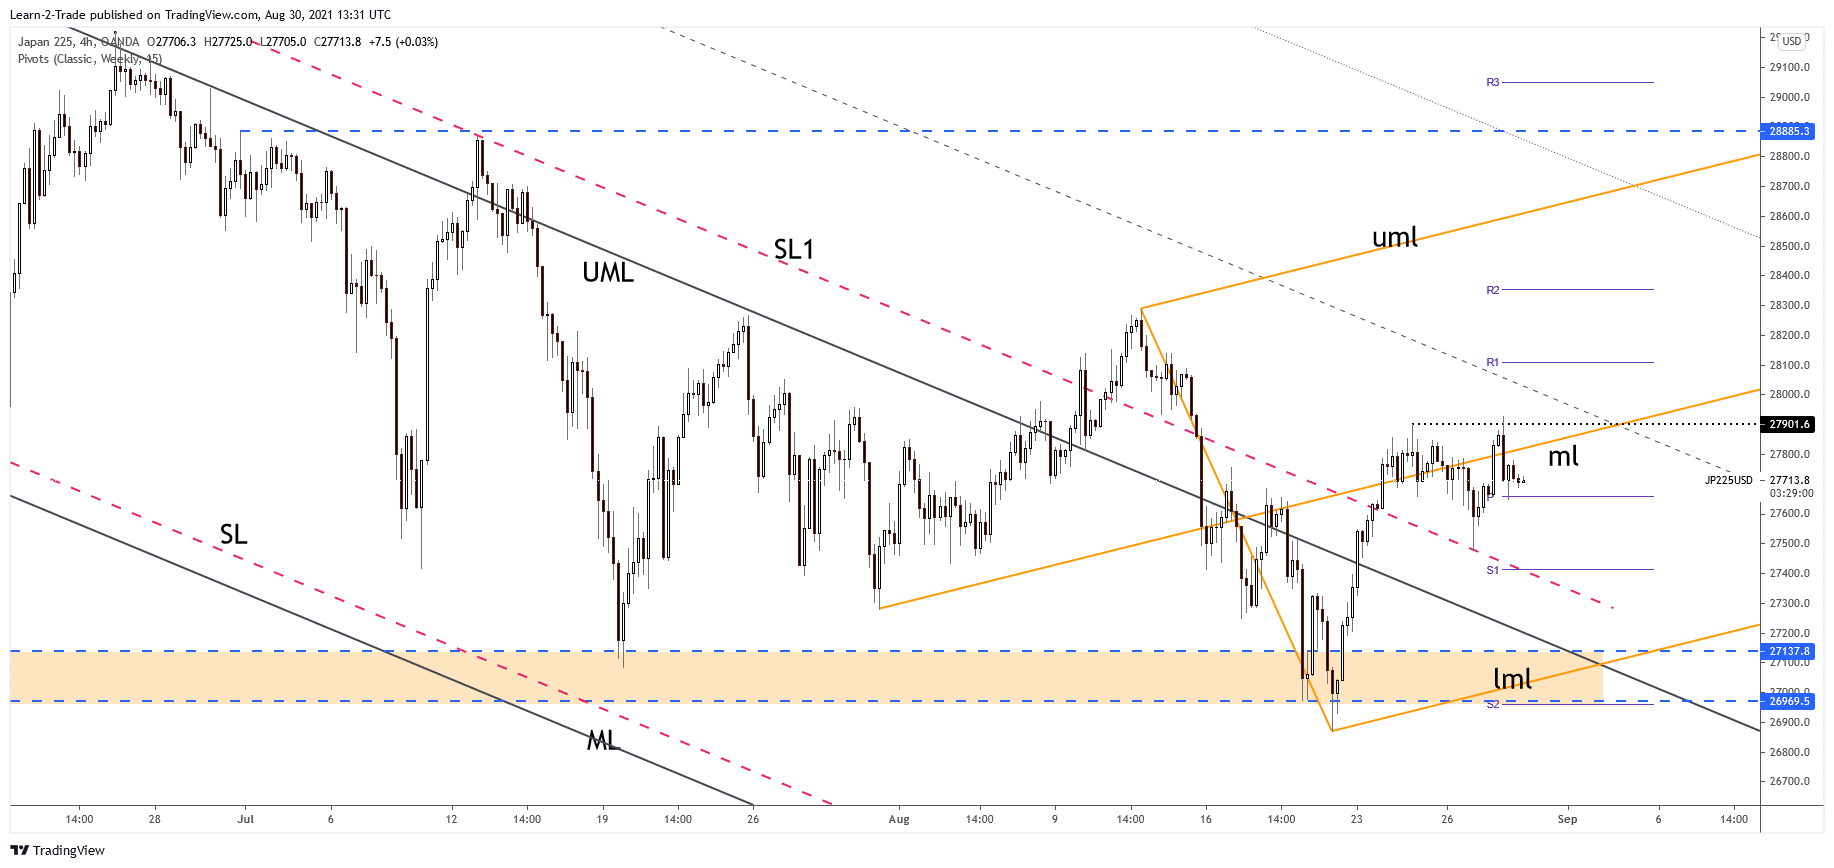
JP225 is trading in the red at 27,671.3 and is almost to hit the 27,658,8 weekly pivot point. Making a valid breakdown below the pivot point could signal a deeper drop. This scenario could signal that the Japanese Yen could rise versus its rivals.
Technically, it has registered another false breakout above the ascending pitchfork’s median line (ml). Also, its failure to close above 27,901, to make a new higher high signaled that JP225 could turn to the downside in the short term.
–Are you interested to learn more about making money in forex? Check our detailed guide-
USD/JPY price technical analysis: Imminent breakout
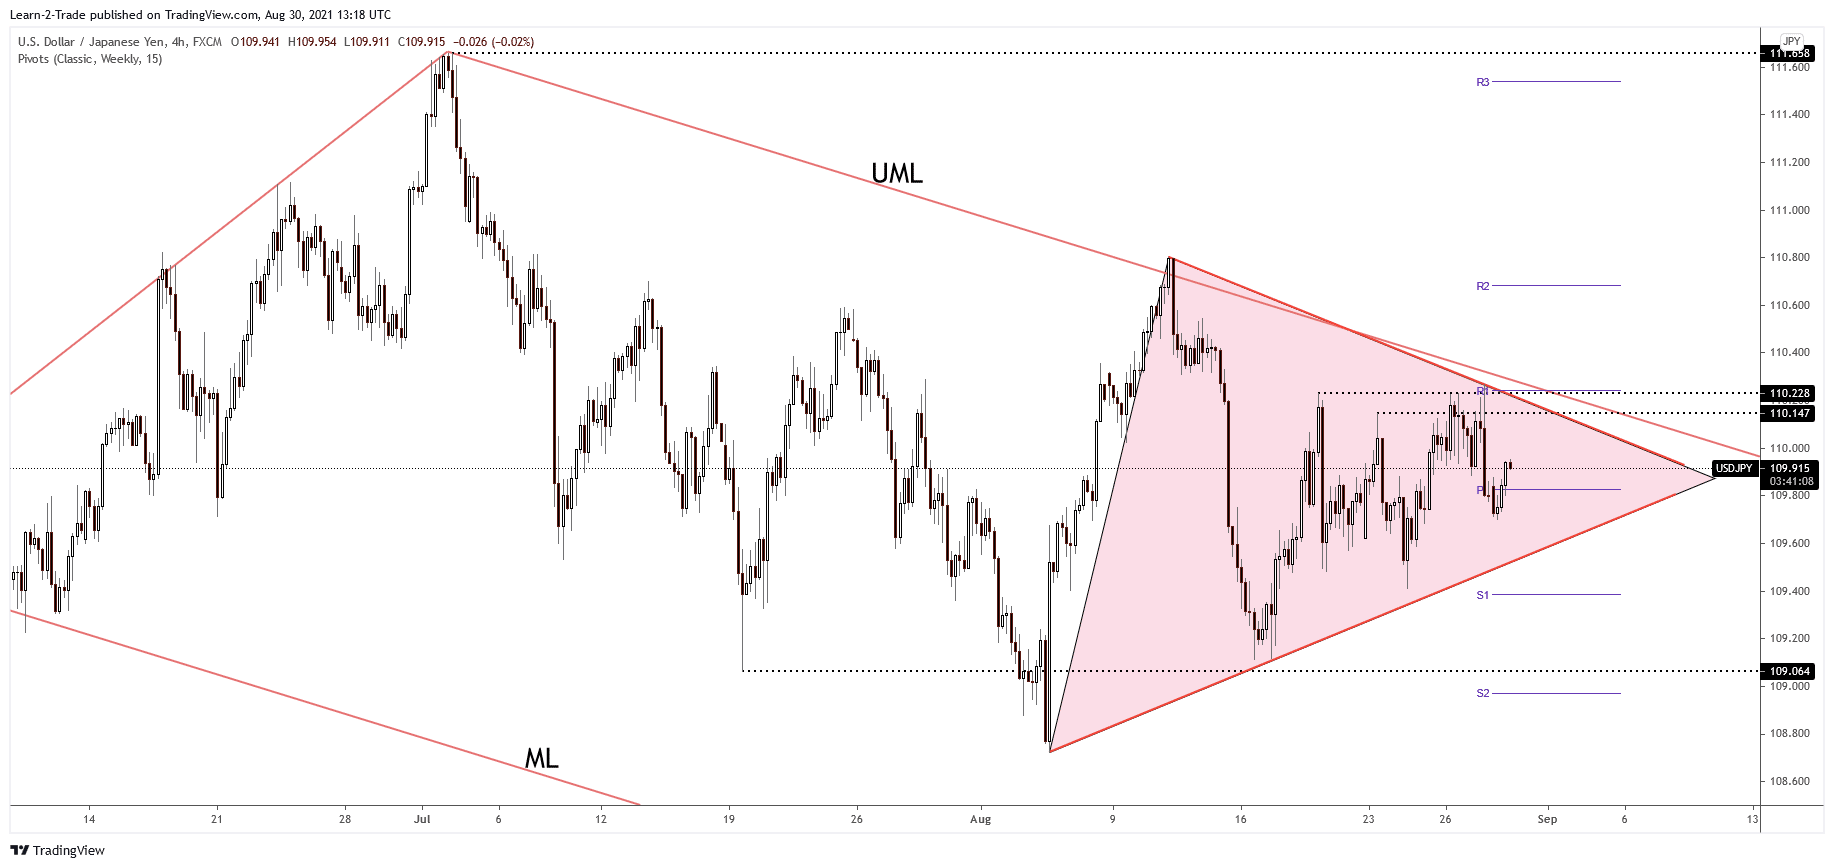
The USD/JPY pair jumped above the weekly pivot point (109.82), and now it stands at the 109.92 level. The price action has developed a new triangle pattern, so only a valid breakout from this formation could bring great trading opportunities.
The price could rise as long as the Dollar Index and the Japanese stock index (JP225) stay higher. 110.14 -110.22 is seen as a strong resistance zone. A valid breakout through this zone could really announce a larger upwards movement in the upcoming period.
Looking to trade forex now? Invest at eToro!
67% of retail investor accounts lose money when trading CFDs with this provider. You should consider whether you can afford to take the high risk of losing your money.
