The Canadian dollar had showed some strength last week, with USD/CAD closing with modest losses. The pair closed the week at 1.1228. This week’s highlights include GDP and an appearance by BoC head Stephen Poloz before a parliamentary committee. Here is an outlook on the major market-movers and an updated technical analysis for USD/CAD.
The Canadian dollar shrugged off a weak consumer spending data, as Core Retail Sales posted a second straight decline. In the US, data was generally positive, with jobless claims and inflation holding on. However, New Homes Sales slumped in September.
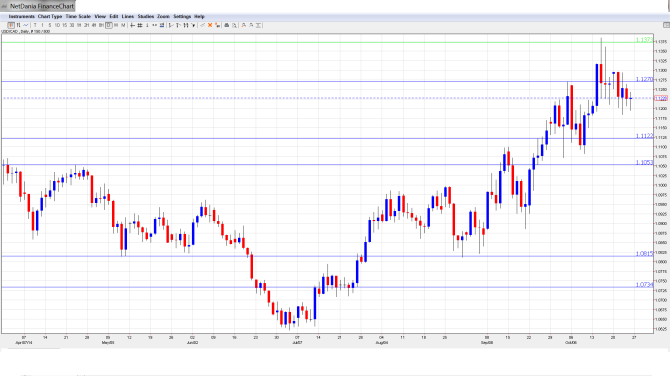
[do action=”autoupdate” tag=”USDCADUpdate”/]USD/CAD daily chart with support and resistance lines on it. Click to enlarge:
- RMPI: Wednesday, 12:30. Raw Materials Price Index measures the change in prices that manufacturers are paying for raw materials. The index has not looked strong, posting three declines in the past four readings. However, a turnaround is expected in the September release, with the estimate standing at 1.5%.
- BoC Governor Stephen Poloz Speaks: Wednesday, 20:15. Poloz will testify before the Senate Standing Committee on Banking, Trade, and Commerce in Ottawa. The markets will be listening closely, looking for any hints regarding the BoC’s future interest rate policy.
- GDP: Friday, 12:30. GDP is one of the most important economic indicators, and should be treated as a market-mover by traders. Unlike most developed economies, Canada releases GDP on a monthly rather than quarterly basis. In August, GDP dipped to a flat 0.0%, shy of the estimate of 0.2% and its lowest reading since January. No change is expected in the upcoming reading, and if the indicator shows contraction. look for the Canadian dollar to respond with losses.
* All times are GMT.
USD/CAD Technical Analysis
USD/CAD opened the week at 1.1290 and quickly touched a high of 1.1296. The pair then broke below resistance at 1.1271(discussed last week), falling to a low of 1.1184. USD/CAD closed the week at 1.1228.
Live chart of USD/CAD: [do action=”tradingviews” pair=”USDCAD” interval=”60″/]
Technical lines, from top to bottom:
We begin with resistance at 1.1640 marked the start of a US dollar rally in July 2009, which saw the pair drop close to the 0.94 line.
1.1494 was a key resistance line in November 2006.
1.1373 was breached in October 2008 as the US dollar posted sharp gains, climbing as high as the 1.21 level. This line has remained steady since July 2009.
1.1271 was easily breached as the Canadian dollar showed some strength, with the pair. It has reverted to a support role.
1.1122 continues to provide strong support and has held firm since early in the month.
1.1054 remains a strong support line. 1.0944 is next.
1.0815 has held firm since late August.
1.0737 marked a cap in mid-2010, before the US dollar tumbled and dropped all the way into 0.93 territory. It is the final support line for now.
I remain bullish on USD/CAD
The markets are expecting a strong GDP for Q3 the US, and if the indicator delivers, the US dollar should have a good week. As well, the Fed is likely to wrap up QE, which should put the markets in a positive mood about the US dollar, as the focus shifts to the timing of a rate hike, which is widely expected in 2015.
In our latest podcast, we preview the all important Fed decision, digest China and examine bitcoin against gold:
Subscribe to our podcast on iTunes.
Further reading:
- For a broad view of all the week’s major events worldwide, read the USD outlook.
- For EUR/USD, check out the Euro to Dollar forecast.
- For the Japanese yen, read the USD/JPY forecast.
- For GBP/USD (cable), look into the British Pound forecast.
- For the Australian dollar (Aussie), check out the AUD to USD forecast.
- USD/CAD (loonie), check out the Canadian dollar.
