USD/CAD showed little change over the week for a second straight week, as the pair closed at 1.3225. This week’s highlight is Retail Sales. Here is an outlook on the major market-movers and an updated technical analysis for USD/CAD.
In the US, the Federal Reserve kept the markets guessing till the very last minute, but in the end refrained from raising rates. US unemployment claims were better than expected, but the Philly Manufacturing Index posted a sharp decline, well below expectations. In Canada, Manufacturing Sales looked sharp, posting a 4-month gain.
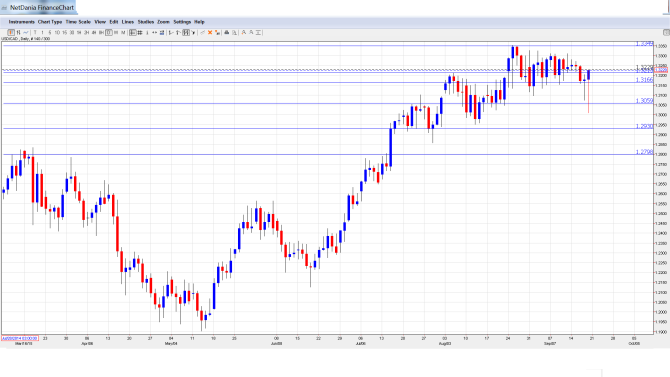
[do action=”autoupdate” tag=”USDCADUpdate”/]USD/CAD daily chart with support and resistance lines on it.
- Wholesale Sales: Monday, 12:30. This week kicks off with Wholesale Sales, a leading indicator of consumer spending. The indicator bounced back in June with a strong gain of 1.3%, beating the estimate of 1.0%. The markets are expecting a soft reading for July, with a forecast of 0.3%.
- BOC Governor Stephen Poloz Speaks: Monday, 18:45. Poloz will speak at an event in Calgary. Analysts will be listening closely for hints regarding interest rate policy.
- Core Retail Sales: Wednesday, 12:30. Core Retail Sales is one of the most important economic indicators, and an unexpected reading can have a strong impact on the movement of USD/CAD. The indicator showed little change in June, posting a respectable gain of 0.8%. Will we see another strong release in July?
- Retail Sales: Wednesday, 12:30. Retail Sales is the primary gauge of consumer spending, and includes volatile items which are excluded from Core Retail Sales. The indicator softened to 0.6% in June, down from 1.0% a month earlier. Still, this was stronger than the estimate of 0.2%.
* All times are GMT.
USD/CAD Technical Analysis
USD/CAD opened the week at 1.3245 and quickly climbed to a high of 1.3280. The pair showed some strong movement late in the week, dropping to a low of 1.3010. USD/CAD closed the week at 1.3225, just above support at 1.3213 (discussed last week).
Live chart of USD/CAD: [do action=”tradingviews” pair=”USDCAD” interval=”60″/]
Technical lines, from top to bottom
We begin with resistance at 1.3759.
1.3587 was a cap in March 2004.
1.3443 is the next line of resistance.
1.3346 has held firm since August 2004.
1.3213 was an important cap in early August.
1.3165 continues to be active. It was tested during the week and remains an immediate support line.
1.3063 continues to protect the symbolic line of 1.30. It was tested late in the week as the Canadian dollar flexed some muscle before retracting.
1.2930 has held firm since late July.
1.2798 is the final support line for now.
I am bullish on USD/CAD
The Fed balked yet again and didn’t hike rates, but the Canadian dollar couldn’t take advantage of the market disappointment. Canada will release key consumer spending numbers this week; if the numbers do not impress, we could see the loonie lose ground.
In our latest podcast we explain why the dollar defies the doves
Further reading:
- For a broad view of all the week’s major events worldwide, read the USD outlook.
- For EUR/USD, check out the Euro to Dollar forecast.
- For the Japanese yen, read the USD/JPY forecast.
- For GBP/USD (cable), look into the British Pound forecast.
- For the Australian dollar (Aussie), check out the AUD to USD forecast.
- For the kiwi, see the NZDUSD forecast.
