The Canadian dollar made gains against the greenback for the 6th consecutive week. Will it continue? Retail sales is the highlight of this week. Here is an outlook on the major market-movers and an updated technical analysis for USD/CAD.
Canada’s consumer price index fell by 0.1% in July contrary to predictions of a 0.2% rise. Annual inflation also dropped in July to 1.3% from 1.5% in June. Meantime core inflation excluding volatile items like energy and fresh fruit and vegetables “” increased 1.7% on a yearly base. These calm inflationary conditions enable the BOC to leave rates unchanged.
Updates: USD/CAD was unchanged, as the pair continued to trade under the 0.99 line. USD/CAD was trading at 0.9880. Wholesale Sales will be released on Tuesday. USD/CAD continues to drop, as the pair was trading at 0.9858. The Canadian dollar has gained over three cents against its US counterpart since late July.
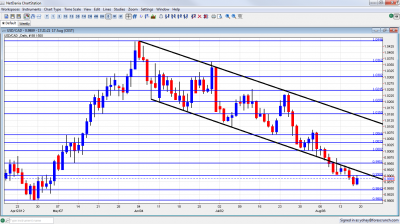
USD/CAD daily chart with support and resistance lines on it. Click to enlarge:
- Wholesale Sales: Tuesday, 12:30. Wholesale activity edged up in May 0.9%, well above prediction for a 0.2% gain and following 1.2% increase in April. Higher sales boosted wholesaling activity reaching C$49.8 billion. These optimistic readings indicate recovery is underway. A smaller increase of 0.4% is expected this time.
- Retail Sales: Wednesday, 12:30. Canadian retail sales increased by a smaller than expected 0.3% in May, following a 0.6% contraction in the previous month. Higher sales volume for food, beverages and clothing offset declines in auto and petrol sales. Meantime Core sales excluding automobiles increased 0.5% in May, much better than the 0.1% gain predicted by analysts and following 0.4% drop in the previous month. Nevertheless the relative slowdown in consumer spending is believed to be temporary due to volatility in financial markets due to the ongoing European crisis. Retail sales is expected to gain 0.2% while core sales is forecasted to increase 0.4%.
- Mark Carney speaks: Wednesday, 15:00. Mark Carney Governor of the BOC will speak at the Canadian Auto Workers Association, in Toronto. His words may offer clues to possible changes in monetary policy.
* All times are GMT.
USD/CAD Technical Analysis
$/C$ traded between the 0.99 and 0.9950 lines (mentioned last week), at the beginning of the week. After breaking below 0.99, this line turned into clear resistance. The trough was at 0.9859.
Technical lines, from top to bottom:
1.0360 was a pivotal line in June 2012 and is now significant resistance. It proved its strength in June 2012. The round number of 1.03 was resistance at the beginning of the year and now returns to this role. It worked perfectly well during June – over and over again, until finally being run through.
1.0245 served as a separator for the move up when the pair rallied in May 2010 and regains some strength now, thanks to capping the pair in July 2012, twice during this month The round figure of 1.02 was a cushion when the pair dropped in November, and also the 2009 trough. It remains a distinct separator after working as such in July.
1.0150 was a swing low in September and worked as resistance several times afterwards. It was challenged in June 2012. and served as a separator in July 2012.
1.0066 was key support before parity. It’s strength during July 2012 was clearly seen and it gave a fight before surrendering. Now, it is somewhat weaker. 1.0030 is another line of defense before parity after capping the pair earlier in the year. The move below this line is not confirmed yet.
The very round number of USD/CAD parity is a clear line of course, and the battle was very clear to see at the beginning of August 2012. Under parity, we meet another pivotal line at 0.9950. It served as a top border to range trading in March 2012 and later as a line in the middle of the range. It also worked well as resistance in August 2012.
0.99, the round number capped the pair in May 2012 and worked in both directions in August. The quick switch from support to resistance showed the resilience of the line. 0.9840 provided support for the pair during September and was reduced to a minor line now.
Lower, 0.9725 worked as strong support back at the fall of 2011. 0.9667, which was another strong cushion in June 2011 is the next line.
The last line for now is 0.9550, which worked as resistance when the pair traded in low ground.
Downtrend Line Now Works as Resistance
After the downtrend channel was broken to the downside, the former line of support turned into good resistance and survived several attempts to breach it, as you can see in the graph. The line worked from mid May and worked perfectly well until the decisive break.
I remain bearish on USD/CAD.
While a correction is coming closer and Canadian data isn’t strong of late, there’s still just a bit more room to the downside before the pair bumps back up. The relatively high oil prices support the loonie.
Further reading:
- For a broad view of all the week’s major events worldwide, read the USD outlook.
- For EUR/USD, check out the Euro to Dollar forecast.
- For the Japanese yen, read the USD/JPY forecast.
- For GBP/USD (cable), look into the British Pound forecast.
- For the Australian dollar (Aussie), check out the AUD to USD forecast.
- For the New Zealand Dollar (kiwi), read the NZD forecast.
- For USD/CAD (loonie), check out the Canadian dollar forecast
- For the Swiss Franc, see the USD/CHF forecast
