The Canadian dollar reversed previous gains and lost the parity line as jobs were a huge disappointment. Here is an outlook on the major market-movers and an updated technical analysis for USD/CAD.
A busy week for Canada saw a strong Ivey PMI and a better than expected trade balance deficit. However, the critical figures came towards the end of the week: Canada lost 21.9K jobs and saw its housing starts plunge. Is the housing sector dragging the economy down?
Updates: Deputy Governor Timothy Lane spoke at Harvard Business School. Outgoing BOC Governor Mark Carney will testify before the House of Commons Standing Committee on Finance in Ottawa. The Canadian dollar has edged higher, as USD/CAD was trading at 1.0046. There are no scheduled Canadian releases until Friday, when the markets will have a chance to see Manufacturing Sales. The G-20 begin a meeting in Moscow on Friday, and a hot topic on the agenda will be currency rates. USD/CAD continues to trade close to the parity level, as the pair was trading at 1.0016.
USD/CAD daily graph with support and resistance lines on it. Click to enlarge: 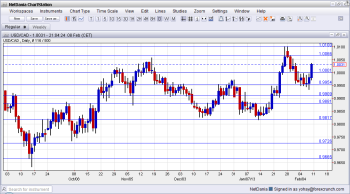
- Timothy Lane talks: Monday, 21:15. The Deputy Governor of the BOC will speak about financial stability and may provide hints to the current stance of the BOC. Is it indeed more dovish?
- Mark Carney talks: Tuesday, 13:45. After speaking in front of a British parliamentarian committee, Carney returns to Ottawa with his colleague Tiff Macklem. Any comments about the housing sector will be watched closely.
- Manufacturing Sales: Friday, 13:30. The total value of sales reported by manufacturers leaped by 1.7% in November, and is now expected to correct and drop by 0.4%.
* All times are GMT.
USD/CAD Technical Analysis
Dollar/CAD began the week trading between parity and the 0.9950 line (both mentioned last week). After a slide lower, the pair eventually made a leap and broke above parity. All in all, USD/CAD is becoming a much more technically friendly pair.
Technical lines, from top to bottom:
1.0250 was a peak before the pair moved below parity. 1.02 was the trough of 2009 and remains important since then, working in both directions.
Another round number, 1.01, was a trough back in July, and switched to resistance afterwards. 1.0066 was key support before parity. It’s strength during July 2012 was clearly seen and it gave a fight before surrendering. It has a stronger role after capping the pair during November 2012.
The very round number of USD/CAD parity is a clear line of course, and the battle was very clear to see at the beginning of August 2012 and also in 2013. 0.9950 provided some support for the pair during November and worked as resistance earlier. Its stubborn behavior as resistance in December proved its strength. This line is close once again.
0.9910 remains the chart after serving as a bottom border for the pair in November 2012. It already managed to work as weak resistance in December 2012. 0.9880 showed that it is a clear separator in October 2012. It also had a role in the past. This line switches roles once again.
0.9817 was a stubborn peak in September and is now significant support. As seen in December 2012, this line worked as a cushion. It worked very nicely in January 2013. Lower, 0.9725 worked as strong support back at the fall of 2011 and showed its strength once again in October 2012.
0.9667, which was another strong cushion in June 2011 is the next line. The round number of 0.96 provided some support back in 2011 and is minor now.
I am bullish on USD/CAD.
The drop in both jobs and housing starts is quite worrying, and so is the close of USD/CAD above parity. The pair could challenge the strong 1.01 line.
Further reading:
- For a broad view of all the week’s major events worldwide, read the USD outlook.
- For EUR/USD, check out the Euro to Dollar forecast.
- For the Japanese yen, read the USD/JPY forecast.
- For GBP/USD (cable), look into the British Pound forecast.
- For the Australian dollar (Aussie), check out the AUD to USD forecast.
- USD/CAD (loonie), check out the Canadian dollar.
