USD/JPY plunged about 250 points last week as the pair closed at 121.92. This marked the pair’s lowest weekly close since mid-May. The upcoming week has just four events. Here is an outlook on the major events moving the yen and an updated technical analysis for USD/JPY.
The Fed minutes did not remove market uncertainty about the timing of a rate hike, as the Fed is clearly hesitant about raising rates in September. This helped the yen post strong gains against the US dollar. Japanese Preliminary GDP contracted in Q2, but managed to meet expectations.
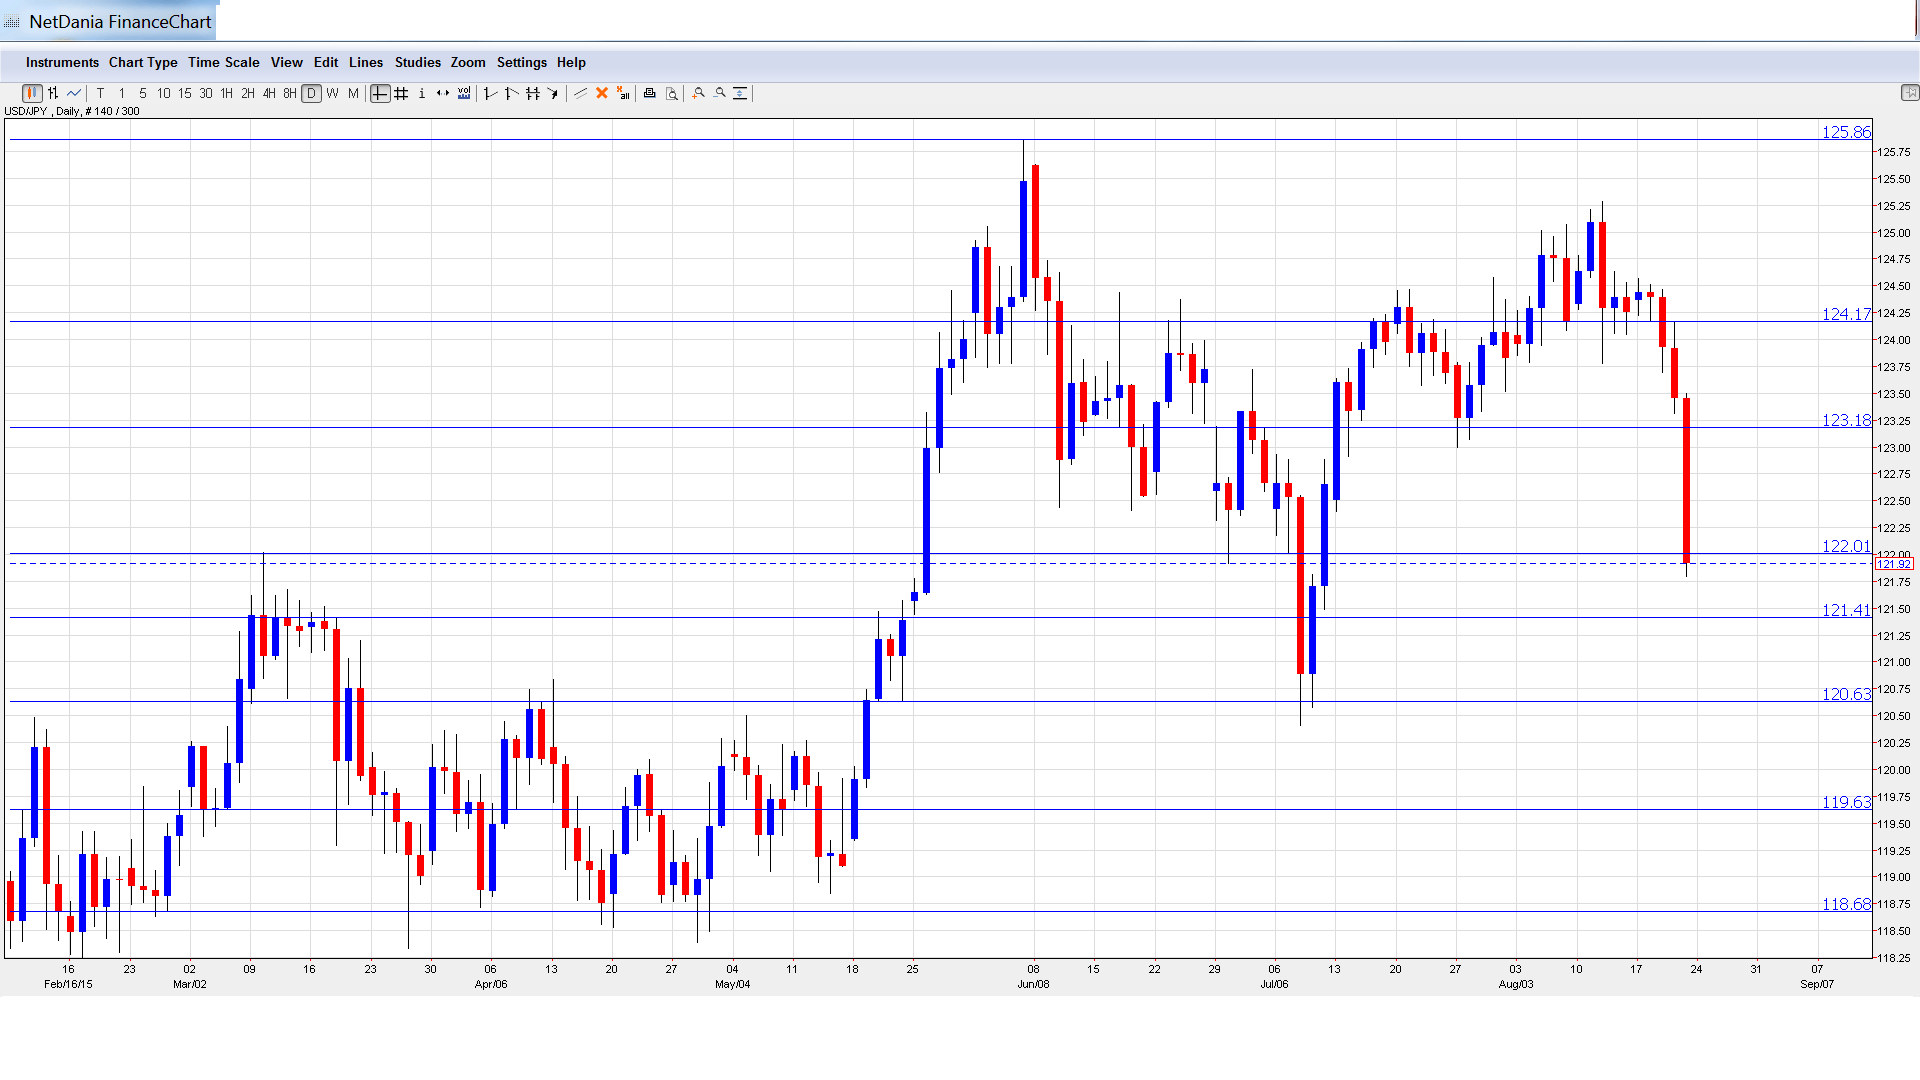
[do action=”autoupdate” tag=”USDJPYUpdate”/]USD/JPY graph with support and resistance lines on it:
- SPPI: Tuesday, 23:50. This minor index measures the change in corporate inflation. The indicator dipped to 0.4% in June, shy of the forecast of 0.6%. The forecast for the June report stands at 0.6%.
- Household Spending: Thursday, 23:30. Household Spending is an important indicator of consumer spending, which is a critical component of economic growth. The indicator had a dismal June, with a sharp decline of 2.0%. This was well off the estimate of a 2.0% gain. The markets are expecting the indicator to bounce back in July, with a forecast of +0.9%.
- Tokyo Core CPI: Thursday, 23:30. This is the most important Japanese inflation index, and should be treated as a market-mover. The index continues to post weak numbers, and dropped 0.1% in July. The markets are expecting another decline of 0.1% in the August report.
- Retail Sales: Thursday, 23:50. Retail Sales is the primary gauge of consumer spending, and an unexpected reading can have an immediate effect on the movement of USD/JPY. The indicator softened in June with a gain of 0.9%, but this was within expectations. The markets are expecting a strong gain of 1.1% in the July report.
* All times are GMT
USD/JPY Technical Analysis
USD/JPY opened the week at 124.36 and quickly climbed to a high of 124.57. It was all downhill from there, as the pair posted sharp losses, dropping to a low of 1.2180, breaking support at 1.2201 (discussed last week). USD/JPY closed the week at 1.2192.
Live chart of USD/JPY: [do action=”tradingviews” pair=”USDJPY” interval=”60″/]
Technical lines from top to bottom:
With the yen posting strong gains, we begin at lower levels:
126.59 has remained intact since May 2002.
125.86 continues to be a strong resistance line.
124.16 was easily breached last week and has switched to a resistance role.
123.18 is next.
122.01 was breached and is currently a weak resistance line.
121.39 is an immediate support level.
120.65 is protecting the symbolic 120 level.
119.65 was a key support line in April.
118.68 is the next support line.
117.44 is the final support level for now. This line has held since February.
I am bullish on USD/JPY
The yen posted excellent gains last week, as the US dollar had a surprisingly poor week against the yen. Will we see a correction from the pair this week? Strong housing and manufacturing US numbers late last week could boost the greenback against the yen.
In our latest podcast we collect the crashes: commodities, Fed hike and later Greece
Further reading:
- For a broad view of all the week’s major events worldwide, read the USD outlook.
- For EUR/USD, check out the Euro to Dollar forecast.
- For the Japanese yen, read the USD/JPY forecast.
- For GBP/USD (cable), look into the British Pound forecast.
- For the Australian dollar (Aussie), check out the AUD to USD forecast.
- For the kiwi, see the NZDUSD forecast.
