USD/JPY dropped as low as the 115 line, but closed the week almost unchanged, at 116.90. This week has six events. Here is an outlook for the highlights of this week and an updated technical analysis for USD/JPY.
In the US, it was a busy start to 2017. The ISM Manufacturing PMI improved and beat expectations. Employment numbers were a mix, as wages edged higher but NFP payrolls fell considerably. The Fed meeting minutes were cautious, as policymakers wait to see how the economy will respond to Donald Trump’s economic policies. In Japan, Final Manufacturing PMI improved and beat expectations.
do action=”autoupdate” tag=”USDJPYUpdate”/]
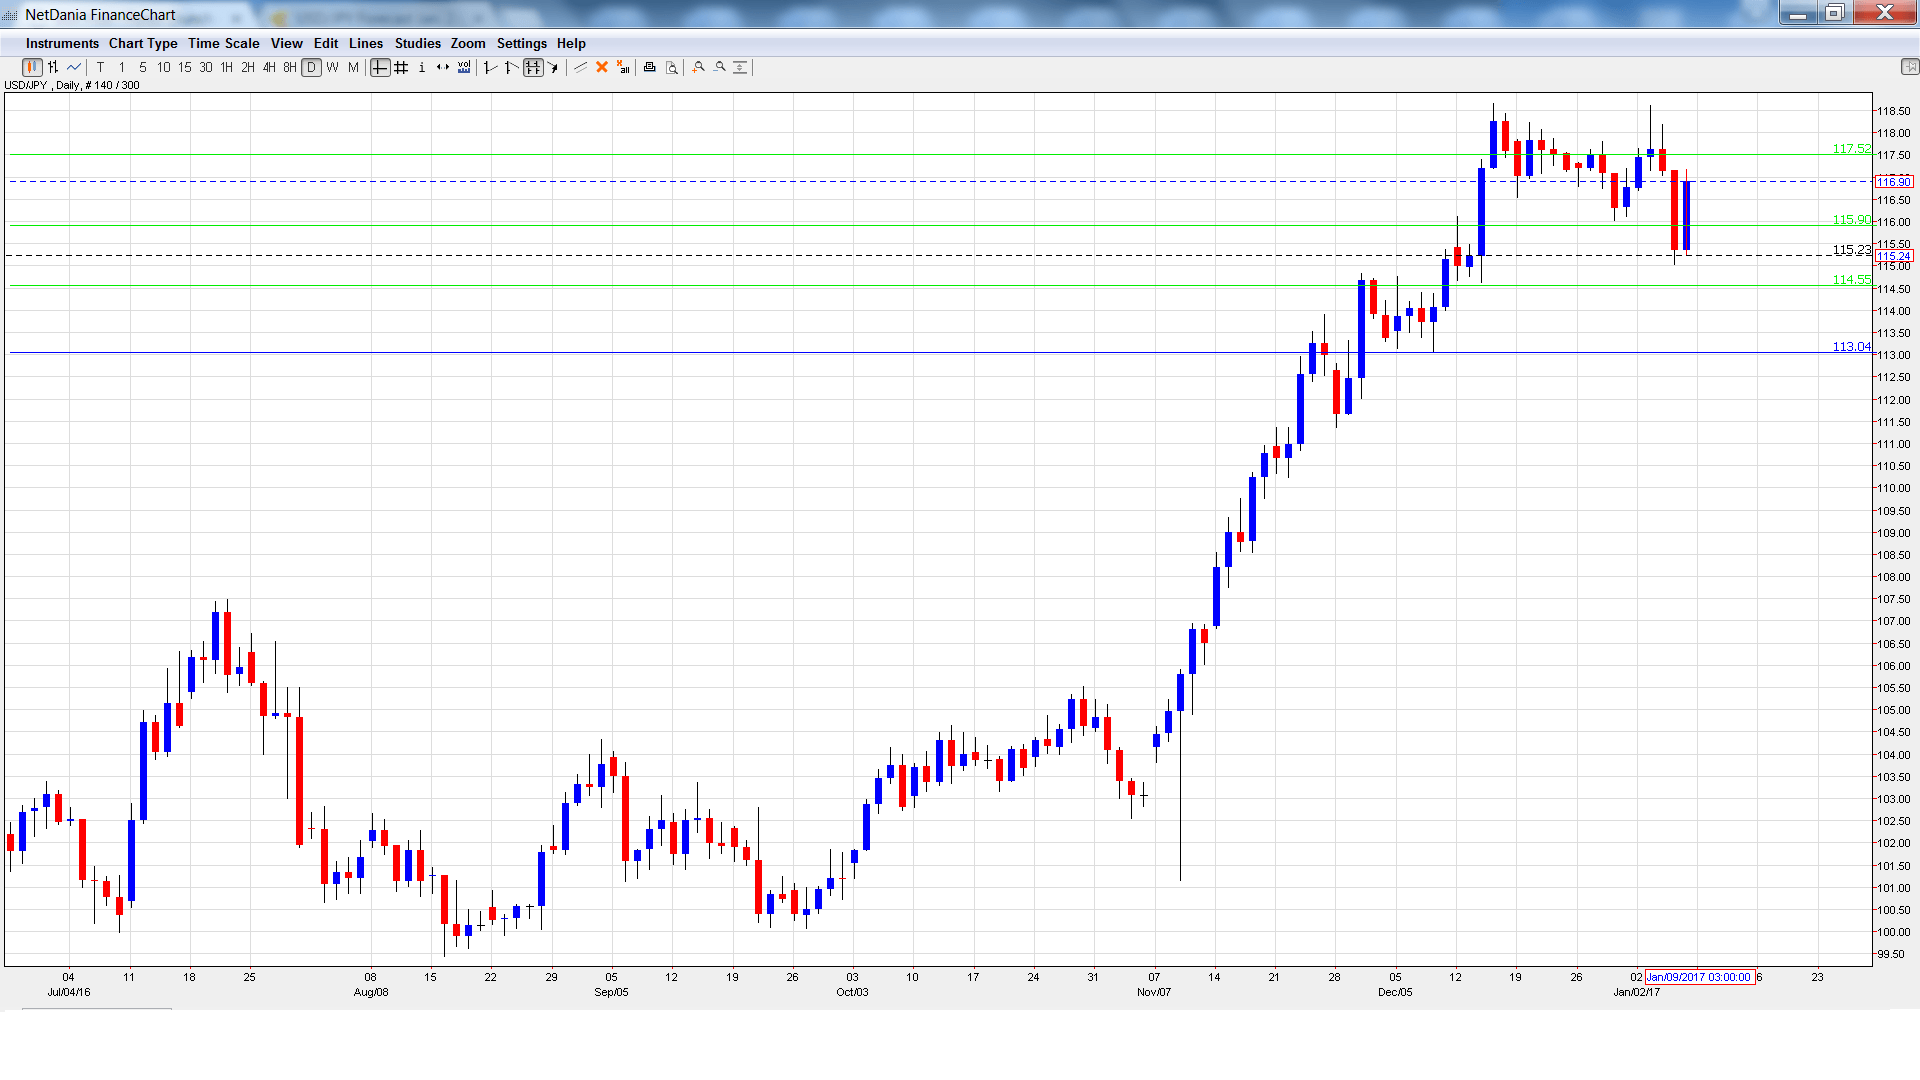
USD/JPY graph with support and resistance lines on it. Click to enlarge:
- Consumer Confidence: Tuesday, 5:00. The indicator has been losing ground, as the Japanese consumer remains pessimistic about the economy. In November, the indicator dropped to 40.9 points, short of the forecast of 43.8 points. The estimate for the December report is 41.3 points.
- 30-year Bond Auction: Wednesday, 3:45. The yields on 30-year bonds rose in the second half of 2016, with the yield improving to 0.62% in December. Will the upward trend continue?
- Leading Indicators: Wednesday, 5:00. In October, the indicator edged lower to 101.0%, within expectations. The forecast for the November estimate is 102.6%.
- Bank Lending: Wednesday, 23:50. Borrowing and spending levels are positively linked, so an increase in borrowing is bullish for the yen. The indicator has posted two straight readings of 2.4%, and no change is expected in the December report.
- Economy Watchers Sentiment: Thursday, 5:00. The indicator has been moving higher but remains under the 50-point level, pointing to continuing pessimism. The indicator is expected to improve to 49.3 points in December.
- M2 Money Stock: Thursday, 23:50. Recent releases have been rising, with the November report climbing to 4.0%. This beat the forecast of 3.7%. The upward trend is expected to continue in December, with an estimate of 4.1%.
USD/JPY Technical Analysis
USD/JPY opened the week at 116.74 and climbed to a high of 118.61, as resistance held at 118.79 (discussed last week). The pair then reversed directions and dropped to a low of 115.04. USD/JPY rebounded at the end of the week, closing at 116.90.
Live chart of USD/JPY:
Technical lines from top to bottom:
121.44 is a strong resistance line.
120.25 is protecting the symbolic 120 level.
118.79 was last breached in February.
117.52 is an immediate support line.
115.90 is next.
114.55 marked a high point in March.
113.04 is the final support level for now.
I remain bullish on USD/JPY
The US economy enters 2017 in fine shape, and president-elect Trump has promised increased fiscal spending and tax cuts, which could increase inflation. If this scenario materializes, the Fed may have to step in with a rate hike in early 2017, which could send the US dollar even higher.
Our latest podcast is titled Is the FED Data or Donald Dependent?
Follow us on Sticher or iTunes
Further reading:
- For a broad view of all the week’s major events worldwide, read the USD outlook.
- For EUR/USD, check out the Euro to Dollar forecast.
- For the Japanese yen, read the USD/JPY forecast.
- For GBP/USD (cable), look into the British Pound forecast.
- For the Canadian dollar (loonie), check out the Canadian dollar forecast.
- For the kiwi, see the NZD/USD forecast.
