USD/JPY posted sharp losses, as the pair dropped below the 111 line for the first time in five weeks. USD/JPY closed at 111.51. This week’s key event is Tokyo Core CPI. Here is an outlook on the major events moving the yen and an updated technical analysis for USD/JPY.
The Federal Reserve was very dovish in its policy statement, sending the greenback to lower levels. There were no surprises from the BoJ statement, as the central bank maintained its current monetary policy.
do action=”autoupdate” tag=”USDJPYUpdate”/]
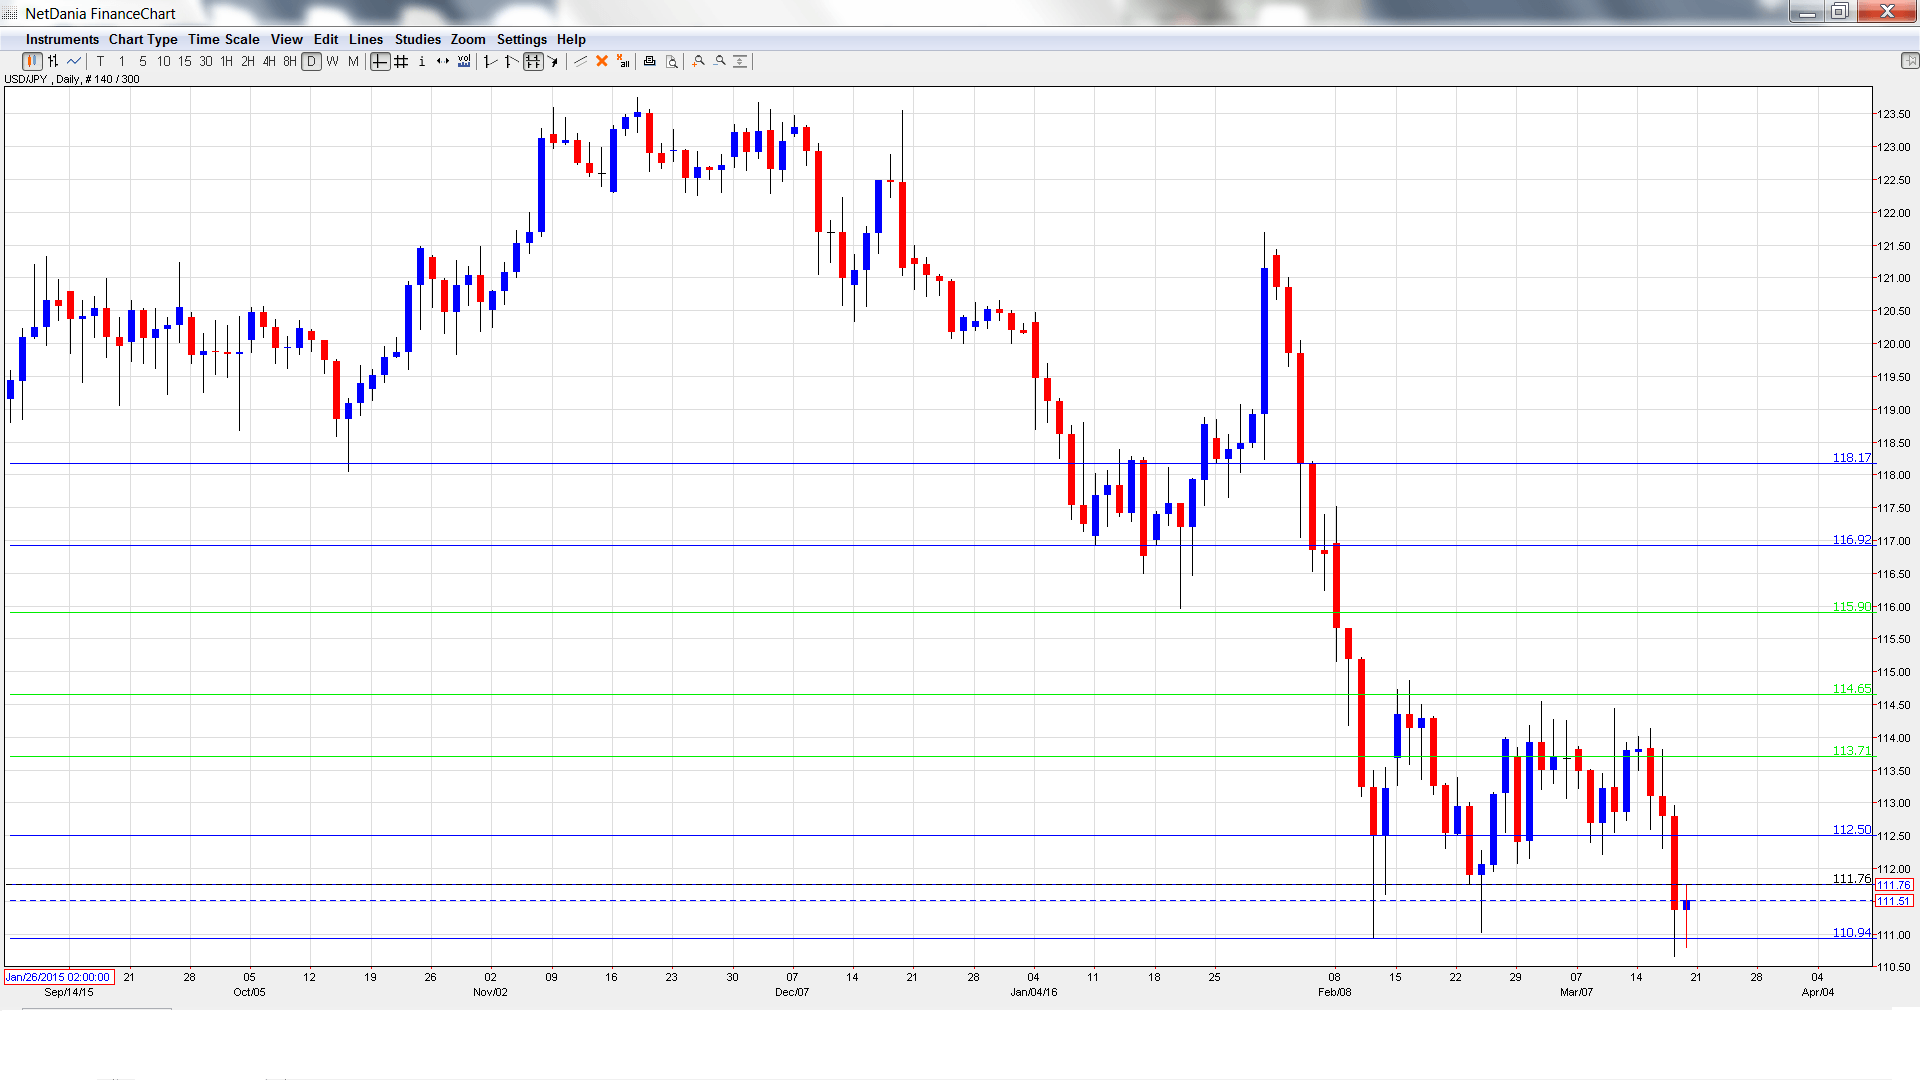
USD/JPY graph with support and resistance lines on it. Click to enlarge:
- Flash Manufacturing PMI: Tuesday, 2:00. This manufacturing indicator slipped in February to 50.2 points, short of the estimate of 52.0 points. The markets are expecting a small gain in March, with a forecast of 50.6 points.
- All Industries Activities: Tuesday, 4:30. This minor indicator has looked weak, posting four declines in the past five readings. The markets are expecting a strong turnaround in the January report, with an estimate of 1.9%.
- BoJ Summary of Opinions: Wednesday, 23:50. This report presents a summary of the discussions held at the BoJ’s policy meeting, without mentioning any policymakers by name. Analysts will be looking for clues about the BOJ’s plans regarding monetary policy.
- Tokyo Core CPI: Thursday, 23:30. This is the key event of the week. The index has posted two straight declines of 0.1%, as the threat of deflation is a serious concern for policymakers. Will the indicator improve in the March report?
- SPPI: Thursday, 23:50. This index measures inflation in the corporate sector. The indicator softened to 0.2% in January, within expectations.
- BoJ Core CPI: Friday, 5:00. The BoJ monitors consumer inflation with this index, which removes the most volatile items which comprise the CPI indicator. Core CPI dipped to 1.1% in January. Will the indicator reverse directions and move upwards in the February report?
* All times are GMT
USD/JPY Technical Analysis
USD/JPY opened the week at 113.77 and quickly touched a high of 114.13. The pair then reversed directions and posted sharp losses, dropping to a low of 110.66, testing support at 110.94 (discussed last week). USD/JPY closed the week at 111.51.
Live chart of USD/JPY: [do action=”tradingviews” pair=”USDJPY” interval=”60″/]
Technical lines from top to bottom:
116.90 supported dollar/yen early in 2015.
115.90 was an important cushion in the second half of 2015.
114.65 held firm for a second straight week, as the yen posted sharp gains before retracting.
113.71 was an important resistance line in July 2005.
112.48 marked the start of a yen rally in January 2008, which saw USD/JPY drop below the 100 level.
110.94 has been a cushion since early February.
109.81 is the next support line.
108.95 was a cushion in May 2006.
107.28 is the final support level for now.
I am neutral on USD/JPY
The Fed statement took some steam out of the US dollar, but the US economy remains solid, and some positive inflation data would go a long way in convincing the Fed to raise rates in the summer. Meanwhile, the BoJ may have run out of monetary ammunition, which leaves the yen room to continue to improve.
In our latest podcast we digest the dovish Fed
Follow us on Sticher or on iTunes
Further reading:
Further reading:
- For a broad view of all the week’s major events worldwide, read the USD outlook.
- For EUR/USD, check out the Euro to Dollar forecast.
- For the Japanese yen, read the USD/JPY forecast.
- For GBP/USD (cable), look into the British Pound forecast.
- For the Australian dollar (Aussie), check out the AUD to USD forecast.
- For the kiwi, see the NZDUSD forecast.
