The Japanese yen had a second strong week, with USD/JPY dipping below uptrend support. The rate decision in Japan is the key event now. Here is an outlook on the major events moving the yen and an updated technical analysis for USD/JPY.
Japanese GDP growth came out at 1.5% in Q1 2014, much better than expected. Stronger economic growth can turn into wage growth and then into stronger inflation: the BOJ’s target. Adding the ongoing tensions in Ukraine, the safe haven yen certainly benefited from the move and hit uptrend support. Can it break below this line now? The big current account deficit was ignored. In the US, data was mostly positive, but the drop in US yields made it hard for the greenback to rally, especially against the yen.
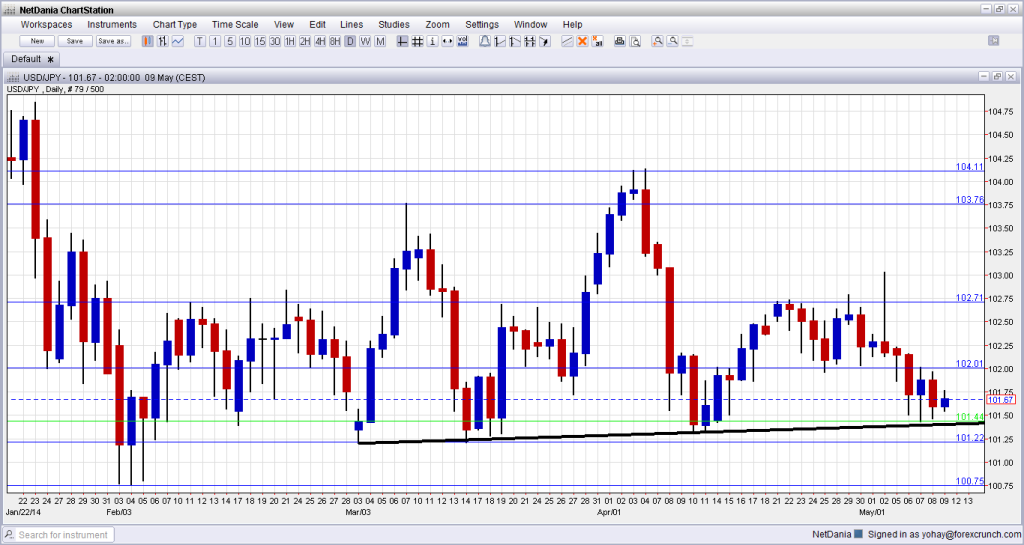
[do action=”autoupdate” tag=”USDJPYUpdate”/]USD/JPY graph with support and resistance lines on it. Click to enlarge:
- Core Machinery Orders: Sunday, 23:50. While this measure is quite volatile, it does have a significant impact. In February, the number of orders or machines plunged by 8.8%. A gain of 6.1% is expected now.
- All Industries Activity: Tuesday, 4:30. The official number from the government showed a disappointing drop of 1.1% in the value of services and goods. A rise of 1.6% is predicted now.
- Rate decision: Wednesday. The Bank of Japan refrained from action in its meetings since the tax hike came into effect in April. So far, they are not worried and do not consider introducing more stimulus. More and more data has been accumulated, and the picture is OK. Under these circumstances, a “no change” decision can be positive for the yen.
- BOJ Monthly Report: Wednesday, 5:00. The monthly report from the Bank also consists of forecasts for inflation. Any shift in these forecasts can provide an indication about the next moves of the BOJ. If inflation is seen as progressing as usual, the yen can advance.
* All times are GMT
USD/JPY Technical Analysis
Dollar/yen began the week with a nice move above 102 (mentioned last week) but the picture changed quite quickly. The pair fell and eventually found support at 101.30, and could not reconquer 102.
Technical lines from top to bottom
The top line is the peak seen in the turn of the year: 105.44. This was challenged several times. Below, 104.80 capped the pair during January.
104.10, the high of April 2014 is currently a minor line, but should be watched. Below, 103.77 provided support for the pair in January and served as a clear separator of ranges.
102.74 was a stubborn peak during February and is the top line of the current trading range. 102.00 is a round number that supported the pair several times and is the botom of the range.
101.30 provided strong support for the pair during May 2014 and is the low line of support. 100.75 prevented the pair from falling lower during February and is the last backstop before the round number of 100.
100 is not just a round number but also worked as resistance several times in the past.
Testing uptrend support
We can observe a moderate uptrend support line (thick black line) accompanying the pair since early March. We have seen the pair dip below this line several times. Can it break below it?
I am bearish on USD/JPY
There is a growing notion that the BOJ will not present new stimulus anytime soon, especially as Japanese growth remain strong. While we cannot expect them to fully close the door on this option, we can expect the lack of hints for action. With US yields at lows, concerns about Ukraine and growing worries about the stock markets, it is easier to see the pair falling, even if the US economy continues improving.
More:
Further reading:
- For a broad view of all the week’s major events worldwide, read the USD outlook.
- For EUR/USD, check out the Euro to Dollar forecast.
- For GBP/USD (cable), look into the British Pound forecast.
- For the Australian dollar (Aussie), check out the AUD to USD forecast.
- For USD/CAD (loonie), check out the Canadian dollar forecast.
- For the kiwi, see the NZDUSD forecast.
