USD/JPY posted strong gains last week, as the pair climbed 230 points. USD/JPY closed at 106.49, close to 14-week highs. This week’s key event is Tokyo Core CPI. Here is an outlook for the highlights of this week and an updated technical analysis for USD/JPY.
The US dollar continues to post broad gains following the Trump election shocker. US inflation numbers were mixed, while unemployment claims dropped to a 43-year low. Japanese Preliminary GDP gained 0.5%, beating expectations.
do action=”autoupdate” tag=”USDJPYUpdate”/]
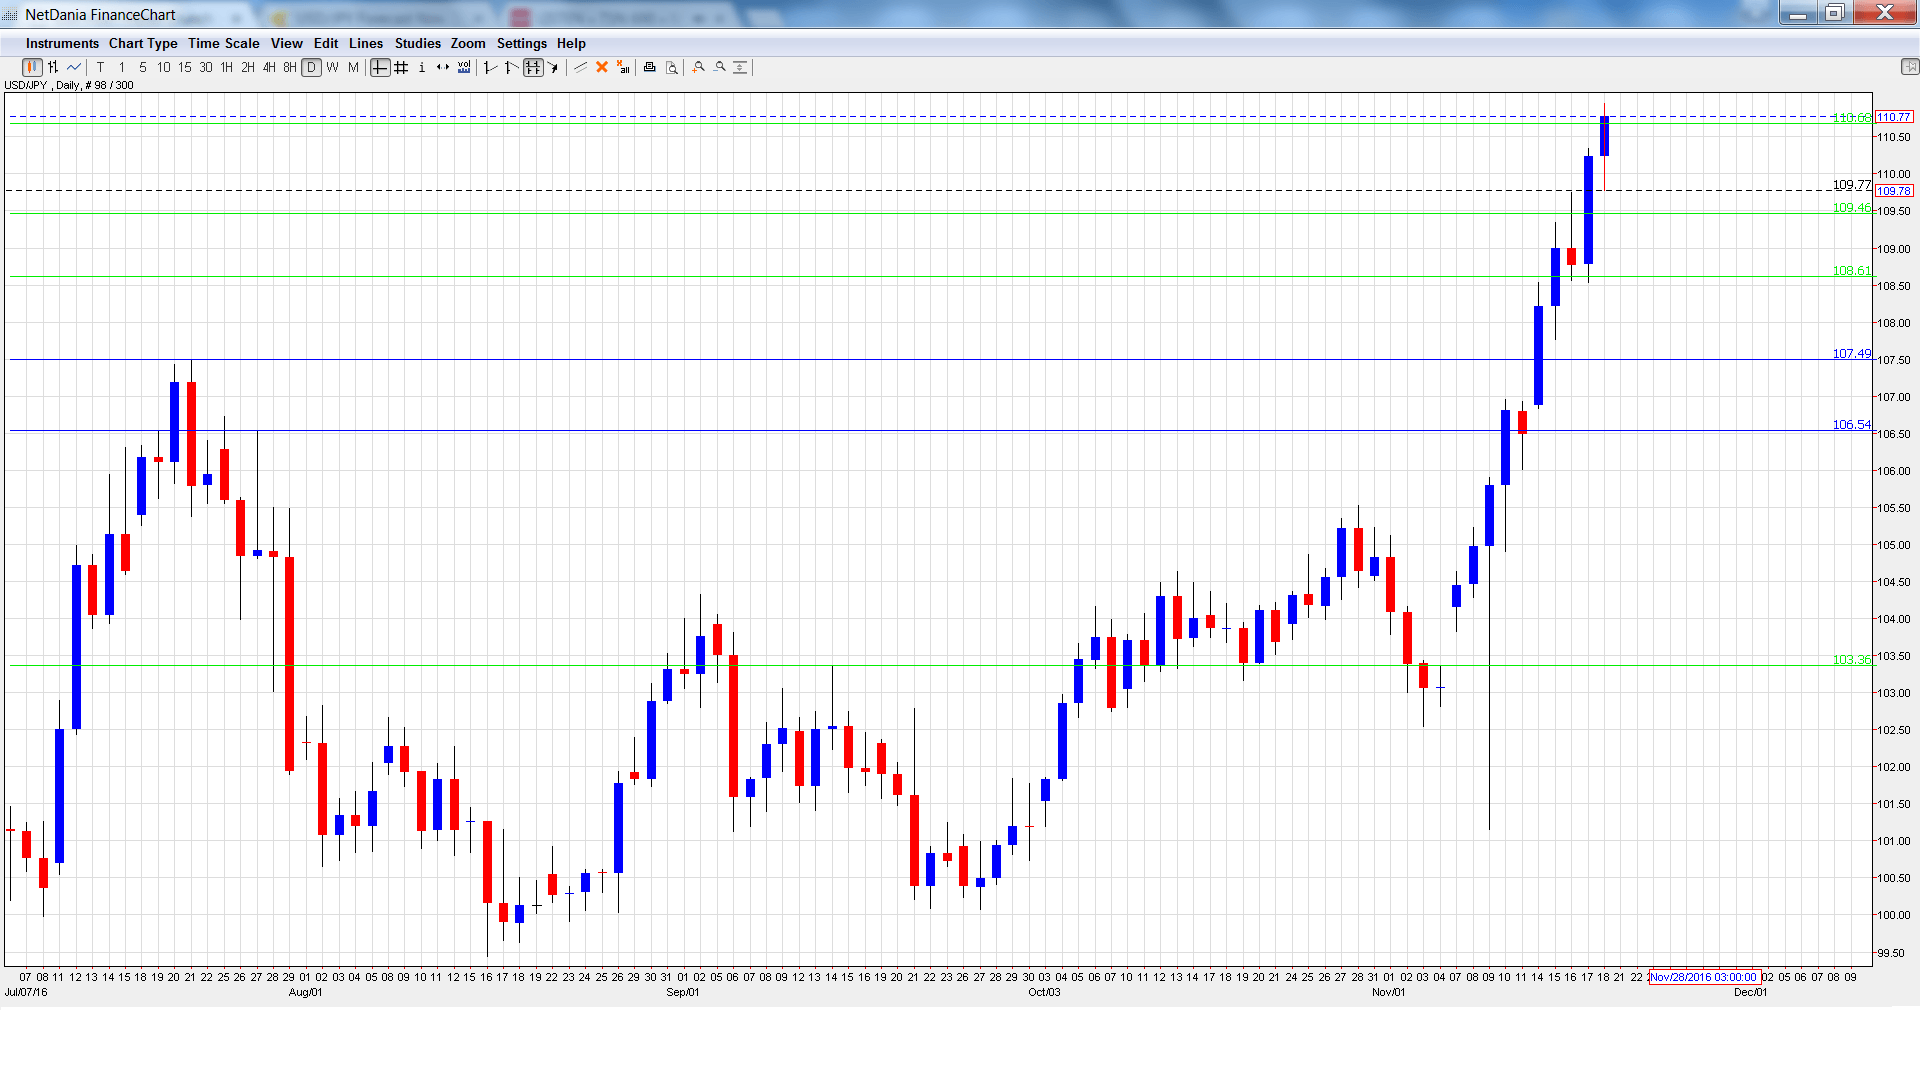
USD/JPY graph with support and resistance lines on it. Click to enlarge:
- Trade Balance: Sunday, 23:50. Japan’s trade surplus dipped to JPY 0.35 trillion in September, but this beat the forecast of JPY 0.21 trillion. The surplus is expected to improve to JPY 0.41 trillion in October.
- All Industries Activity: Monday, 4:30. This minor reading edged lower to 0.2% in September, matching the forecast. The downward trend is expected to continue in October, with an estimate of 0.1%.
- Flash Manufacturing PMI: Thursday, 00:30. The index improved to 51.7 points in September, pointing to slight expansion in the manufacturing sector. This beat the estimate of 50.6 points. The estimate for October stands at 51.7 points.
- Tokyo Core CPI: Thursday, 23:30. The index continues to post declines, as deflation continues to grip the Japanese economy. Tokyo Core CPI is expected to remain unchanged at -0.4%.
- SPPI: Thursday, 23:30. This index measures inflation in the corporate sector. In September, the index rose to 0.3%, above the forecast of 0.2%. Another gain of 0.3% is expected in the October report.
- BoJ Core CPI: Friday, 5:00. The index has been steadily losing ground and dropped to 0.2%, shy of the estimate of 0.3%. The estimate for the upcoming report stands at 0.3%.
* All times are GMT
USD/JPY Technical Analysis
The pair opened the week at 106.88 and quickly dropped to a low of 106.84, as support held firm at 106.55 (discussed last week). It was all uphill from there, as USD/JPY climbed to a high of 110.95. The pair closed the week at 110.77.
Live chart of USD/JPY:
Technical lines from top to bottom:
With USD/JPY posting strong gains last week, we start at higher levels:
112.53 is a strong resistance level.
111.45 has provided resistance since May.
110.68 is next.
109.46 has switched to a support role for the first time since June.
108.61 is the next support line.
107.49 was the high point in July.
106.54 is the final support line for now.
I am bullish on USD
The US dollar has been red-hot since the US election, and the currency could make further inroads this week. With the Fed expected to raise rates in December, sentiment towards the greenback is very favorable.
Our latest podcast is titled Not all financial assets are Trump-ed equally
Follow us on Sticher or iTunes
Safe trading!
Further reading:
- For a broad view of all the week’s major events worldwide, read the USD outlook.
- For EUR/USD, check out the Euro to Dollar forecast.
- For the Japanese yen, read the USD/JPY forecast.
- For GBP/USD (cable), look into the British Pound forecast.
- For the Canadian dollar (loonie), check out the Canadian dollar forecast.
- For the kiwi, see the NZD/USD forecast.
