The Japanese yen gained ground for a second straight week, as USD/JPY rose to 101.92. It’s a quiet week, with four events this week. Here is an outlook for the highlights of this week and an updated technical analysis for USD/JPY.
The Japanese BSI Manufacturing Index posted a gain of 2.9 points, ending a nasty streak of two straight declines. US data was a mixed bag last week. Retail sales contracted and missed expectations. However, CPI and jobless claims were slightly better than expected.
do action=”autoupdate” tag=”USDJPYUpdate”/]
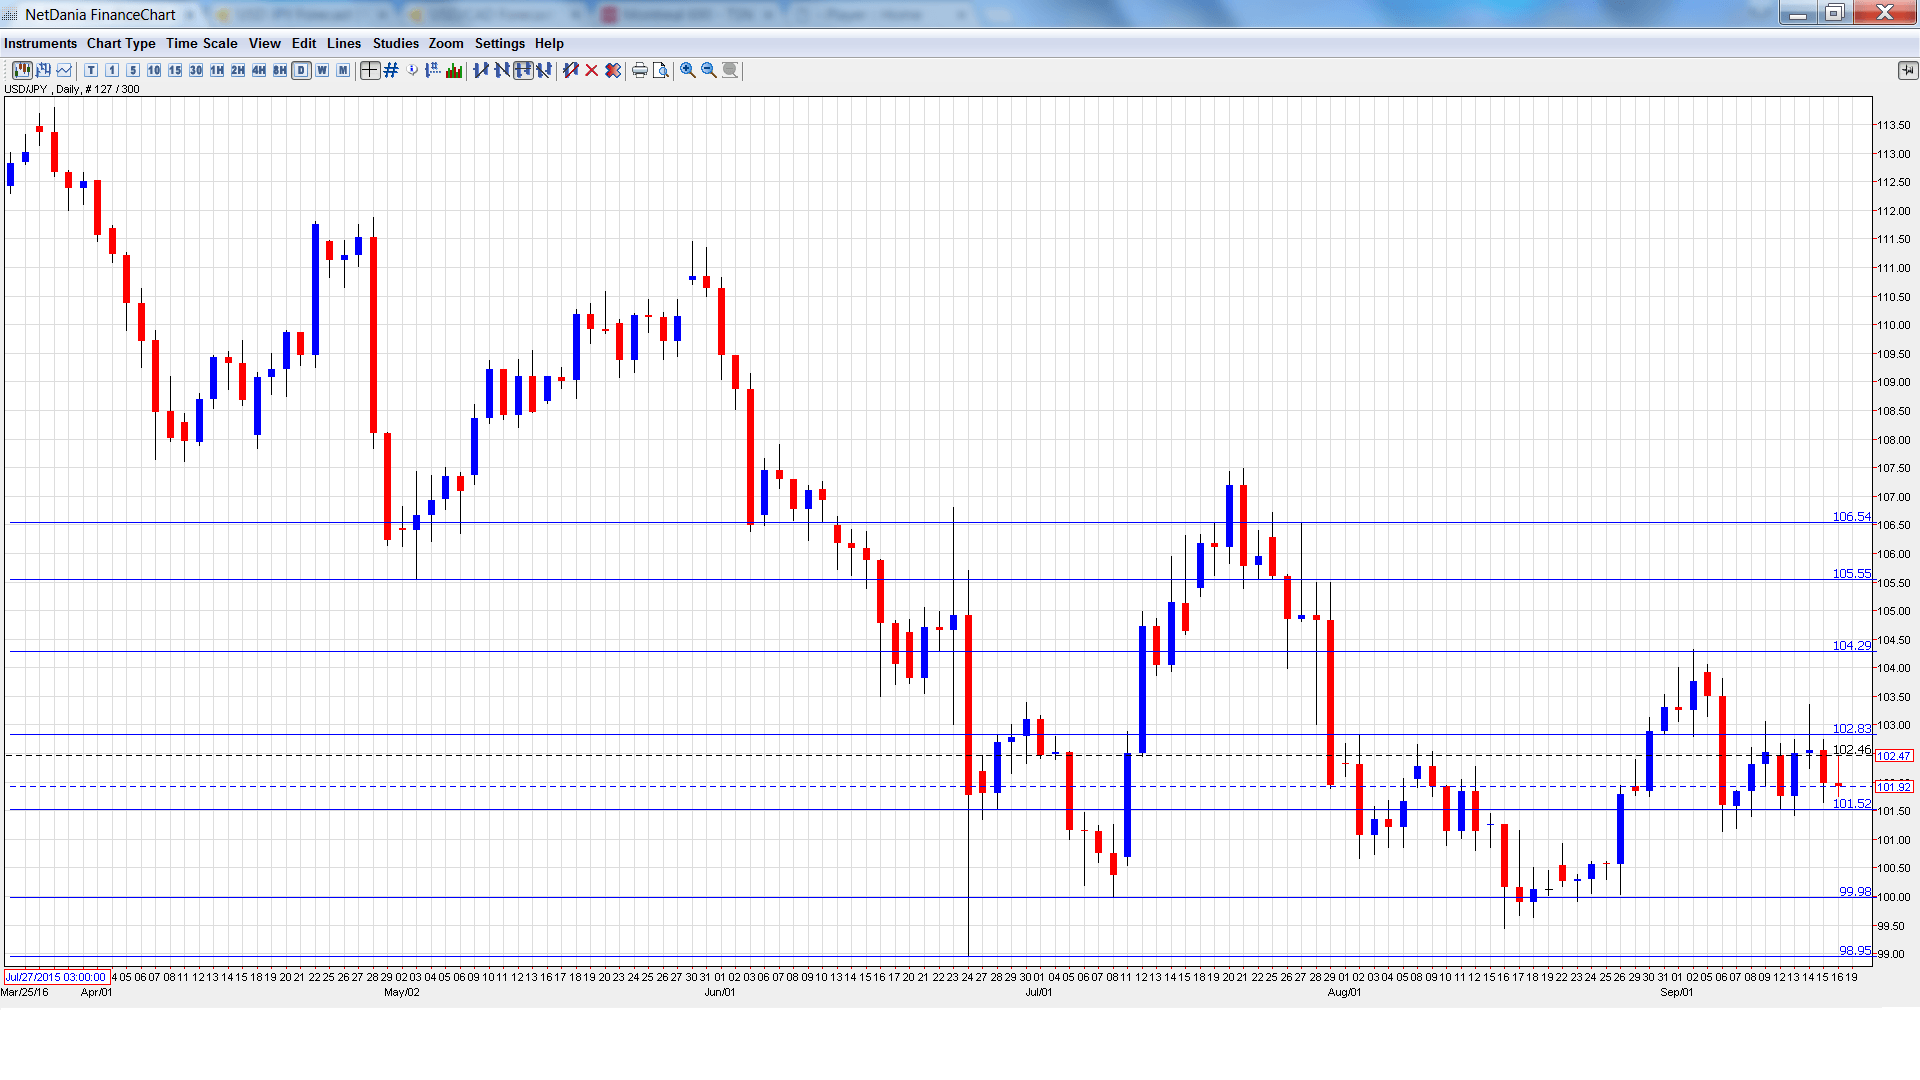
USD/JPY graph with support and resistance lines on it. Click to enlarge:
- Trade Balance: Tuesday, 23:50. Japan’s trade surplus barely moved in July, with a reading of JPY 0.32 trillion. This easily beat the forecast of JPY 0.14 trillion. The markets are expecting a stronger surplus in August, with an estimate of JPY 0.50 trillion.
- BoJ Monetary Policy Statement: Wednesday, Tentative. The BoJ has remained all the sidelines for months, but that could change at this policy meeting. If the BoJ deepens negative rates, the yen could lose ground. The statement will be followed by a press conference hosted by BoJ Governor Haruhiko Kuroda.
- Flash Manufacturing PMI: Friday, 00:30. The PMI continues to post readings below the 50 level, indicative of ongoing contraction in the manufacturing sector. Little change is expected in the September release, with an estimate of 49.3 points.
- All Industries Activity: Friday, 4:30. The indicator posted rebounded strongly in June, posting a gain of 1.0%. This edged above the forecast of 0.9%. The markets are expecting a much softer gain in July, with the estimate standing at 0.2%.
* All times are GMT
USD/JPY Technical Analysis
USD/JPY opened the week at 102.47 and dropped to a low of 101.92, as resistance held firm at 101.51 (discussed last week). The pair then reversed directions and climbed to a high of 103.36. USD/JPY then retracted and closed the week at 101.92.
Live chart of USD/JPY:
Technical lines from top to bottom:
We begin with resistance at 106.54.
105.55 was a cushion in May and June.
104.25 is next.
102.83 has strengthened in resistance as USD/JPY posted losses last week.
101.52 is a weak support level.
99.98 is just below the symbolic round number of 100.
98.95 has provided support since late June.
97.61 has provided support since November 2013. It is the final support line for now.
I remain bullish on USD/JPY
The Bank of Japan has stayed on the sidelines for months, but could adopt further easing measures at next week’s policy meeting, which would likely weigh on the yen. The US is headed in the opposite direction, with the Fed signaling that it could take action and raise rates before the end of the year.
Our latest podcast is titled Brexit: Bad, Bearable or Brilliant?
Follow us on Sticher or iTunes
Further reading:
- For a broad view of all the week’s major events worldwide, read the USD outlook.
- For EUR/USD, check out the Euro to Dollar forecast.
- For the Japanese yen, read the USD/JPY forecast.
- For GBP/USD (cable), look into the British Pound forecast.
- For the Canadian dollar (loonie), check out the Canadian dollar forecast.
- For the kiwi, see the NZD/USD forecast
