- It seems that Vechain price broke out of an ascending triangle pattern on the 12-hour chart.
- The long-term price target for the bulls is located at $0.026.
Vechain was trading inside a long-term ascending triangle pattern on the 12-hour chart from which it has broken out and now aims to hit a new 2020-high at $0.026. The digital asset faces very little resistance to the upside.
Vechain price looks strong and poised for a run to $0.026
On the 12-hour chart, Vechain bulls were able to push the digital asset above an ascending triangle pattern, cracking the critical resistance level at $0.018 decisively, with Vechain price hitting $0.0196.
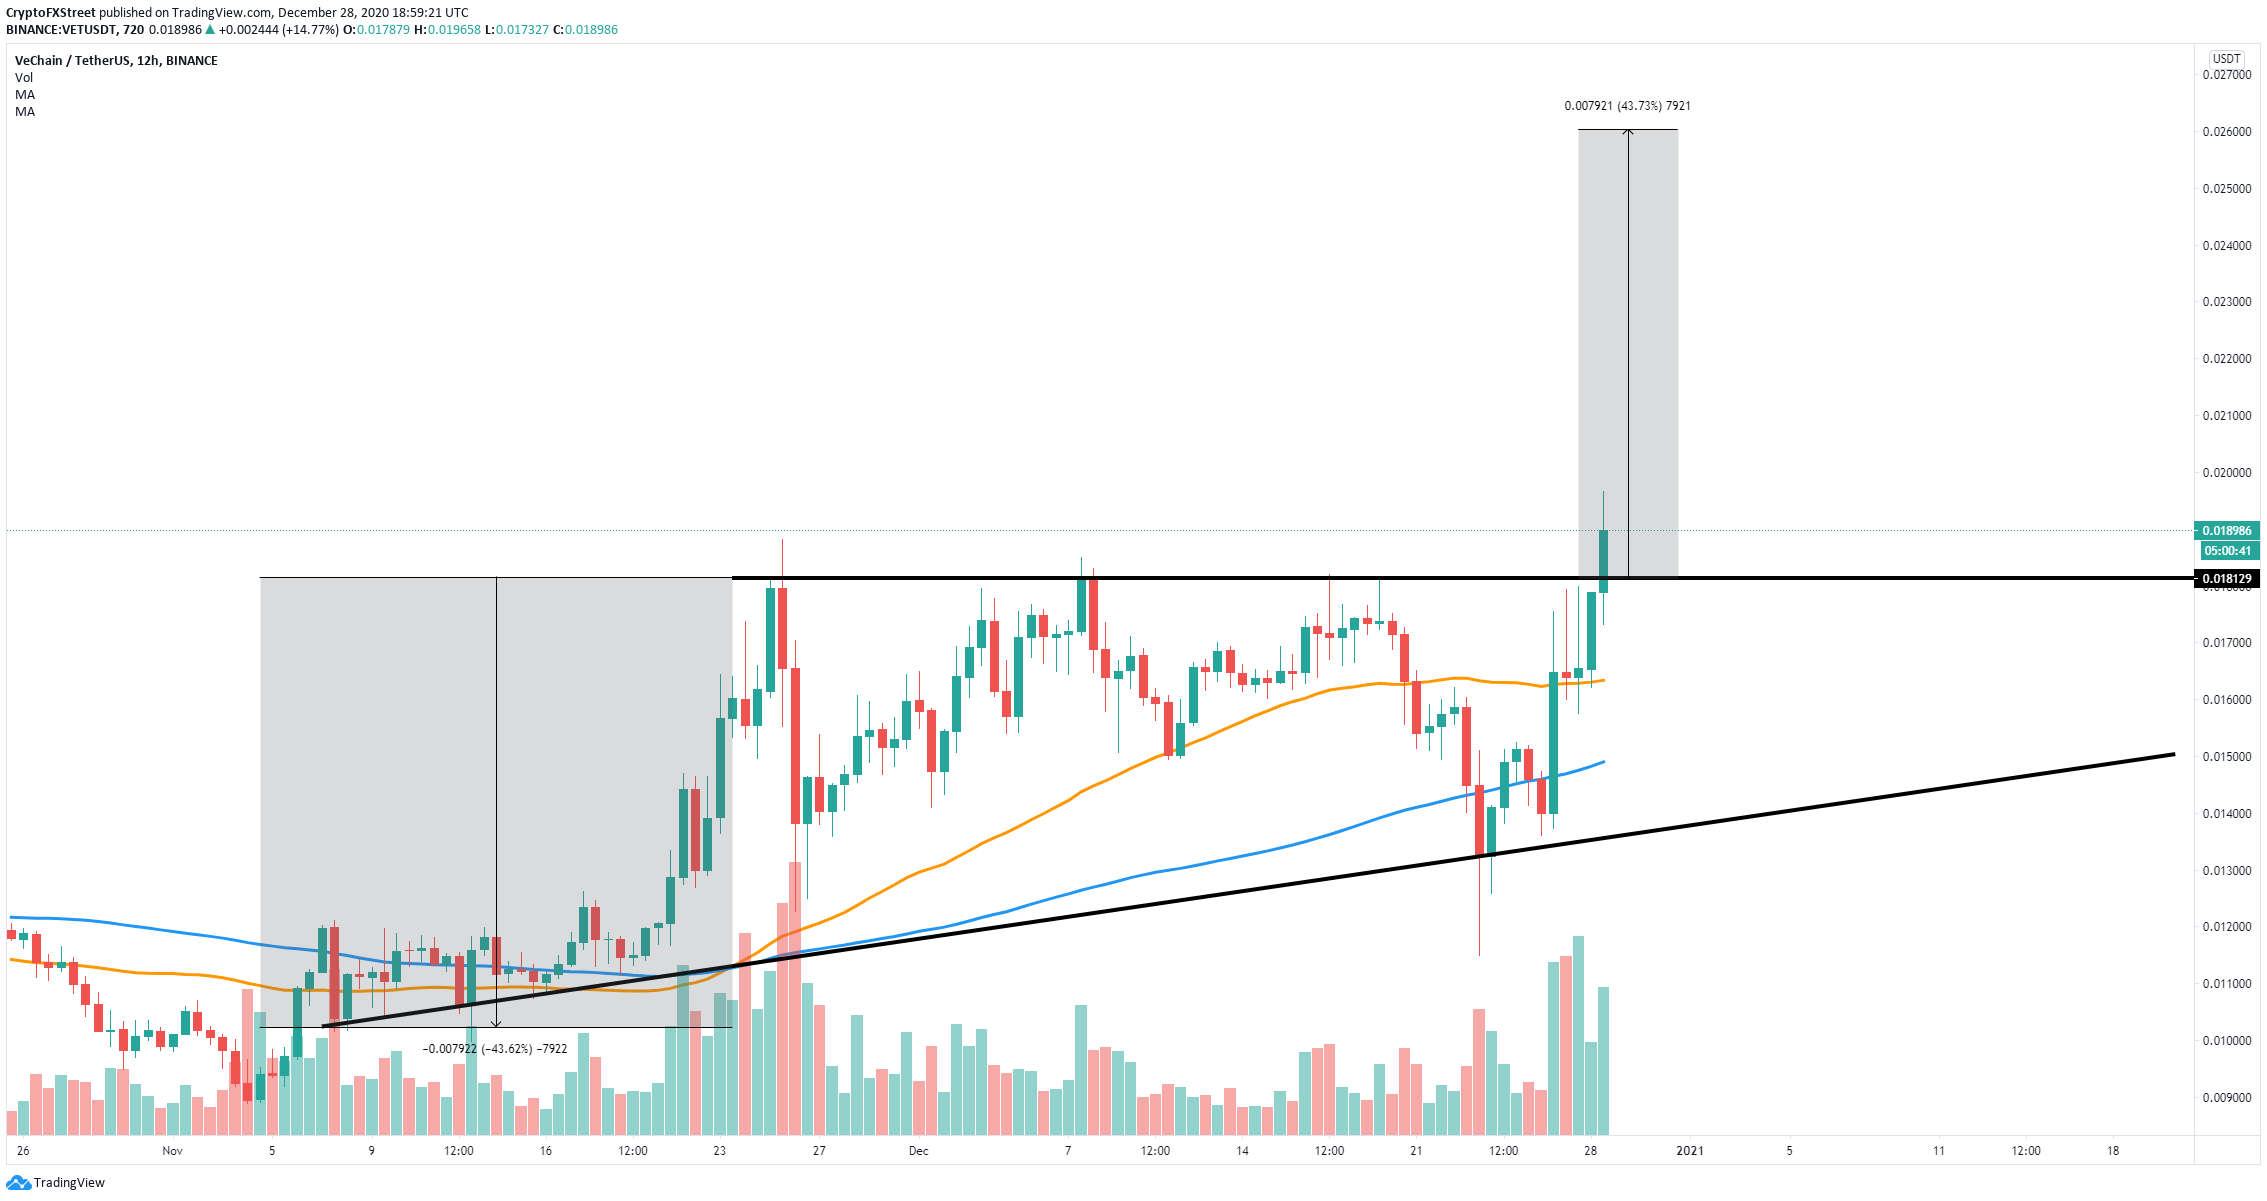
VET/USD 12-hour chart
Vechain has managed to conquer the 50-SMA and the 100-SMA and turn both into support levels. The breakout of the ascending triangle means that VET targets $0.026, a 43% move which can be calculated using the height of the pattern as a reference point.
The only potential bearish outlook for Vechain is a re-test of the broken resistance level at $0.018. Usually, after a breakout above a triangle pattern, the digital asset might come back down to re-test the previous resistance.
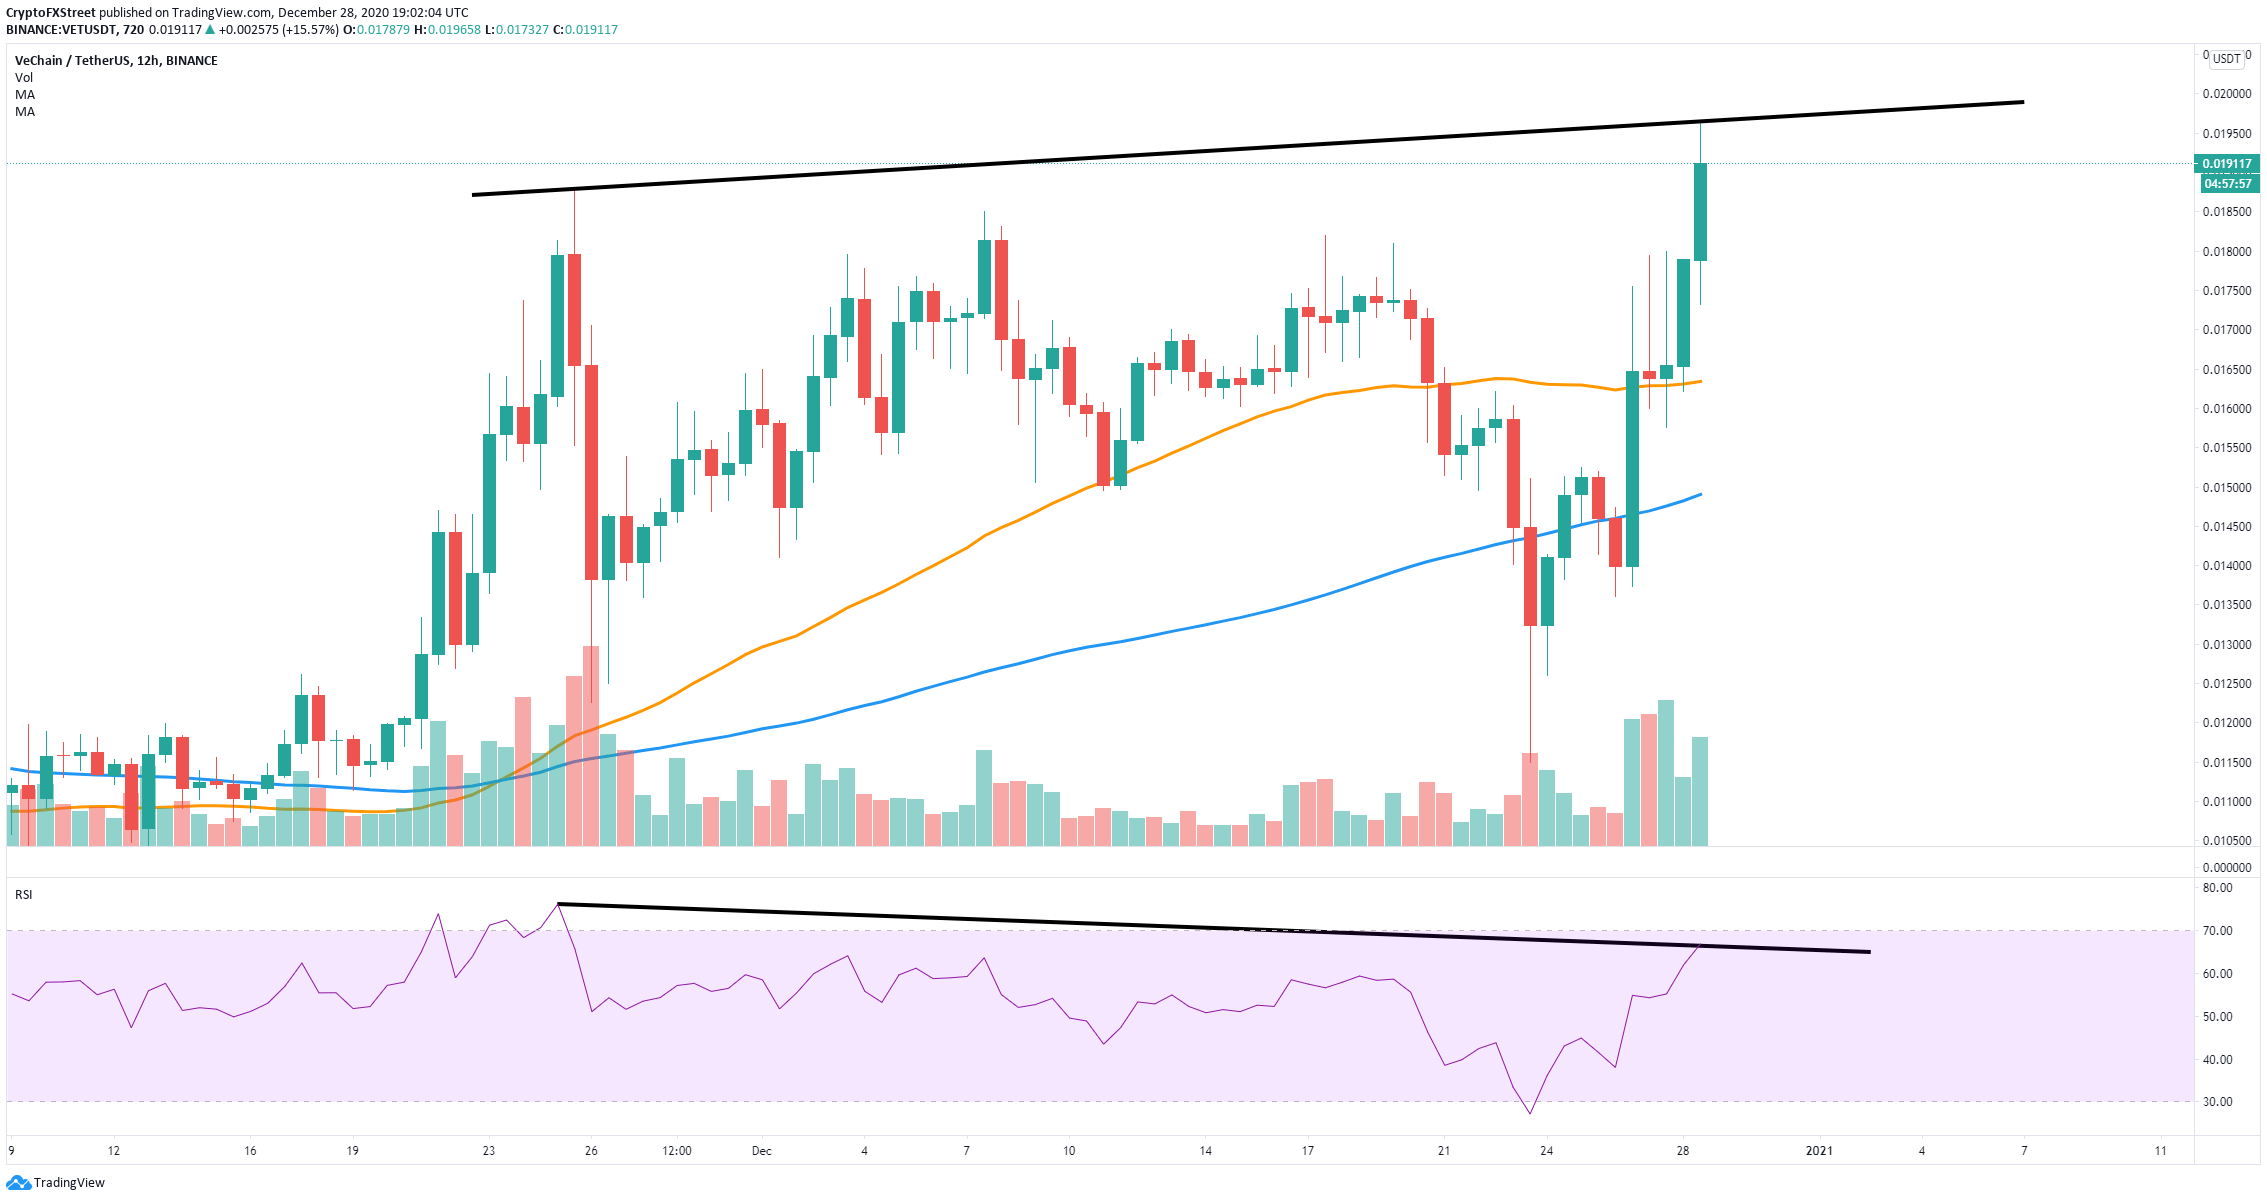
VET/USD 12-hour chart
Additionally, there seems to be an RSI divergence with the price on the 12-hour chart as Vechain price has set higher highs, but the RSI established lower highs. This is considered bearish. The potential price target for bears would be the 50-SMA at $0.016.
