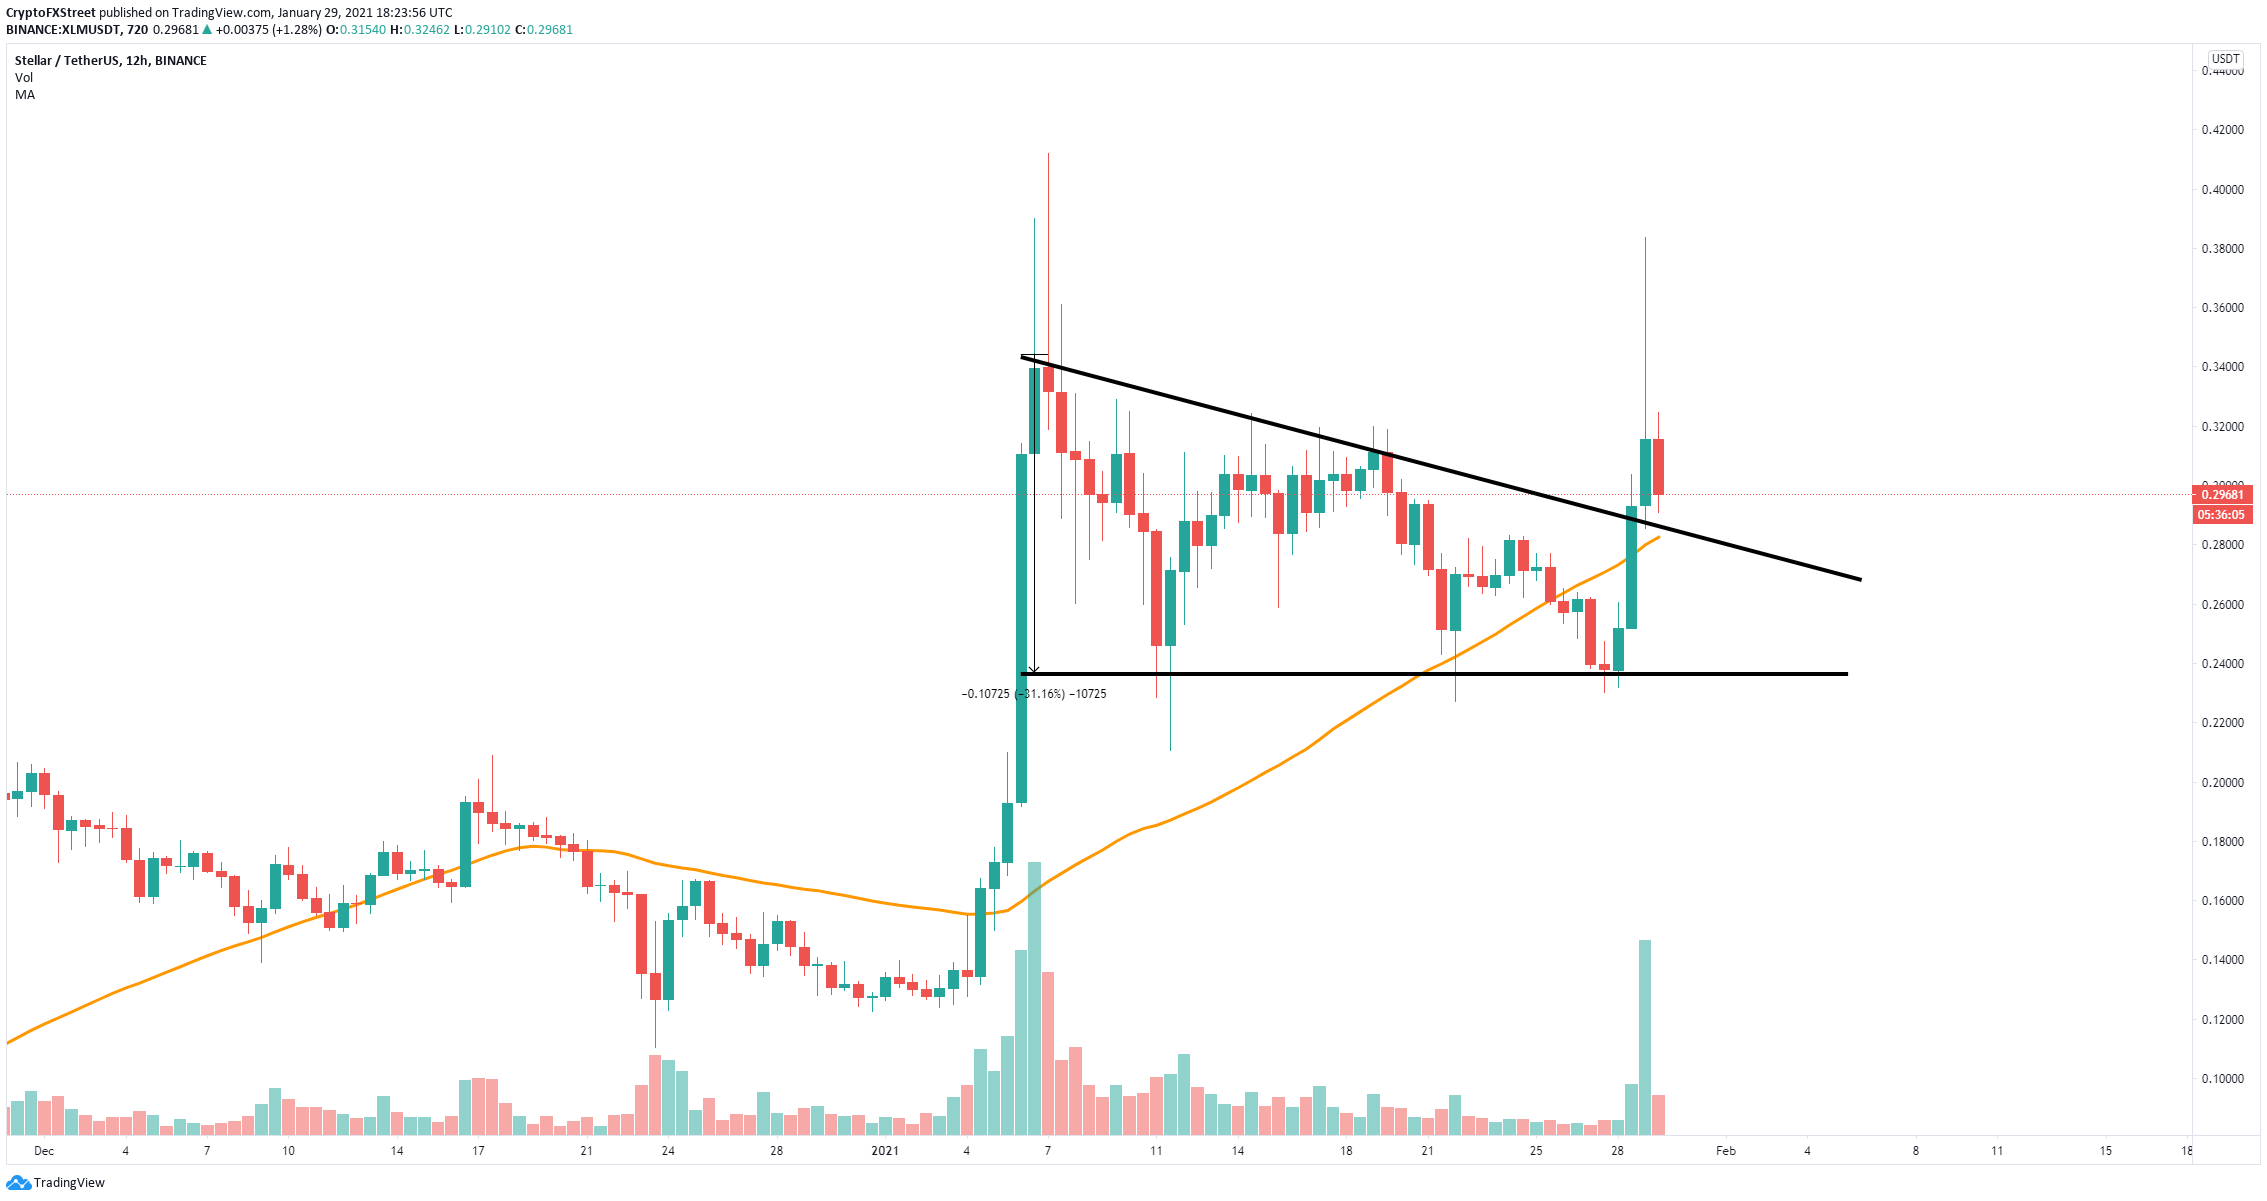
- XLM price had a significant 30% breakout above a descending triangle pattern on the 12-hour chart.
- The digital asset topped out at $0.38 before plummeting.
- It seems that the breakout wasn’t as strong as the bulls hoped.
XLM price topped out at $0.411 on January 7 and has been under consolidation since then. After a significant breakout that started on January 28, the digital asset hit $0.383 but quickly dropped towards $0.291.
XLM price could be poised for a deeper fall
After a successful breakout above the resistance trendline at $0.29, XLM price jumped by 30% but saw a massive rejection at $0.383 and dropped to $0.291 within the next 12 hours. This massive dive shows that the breakout, although meeting its target, couldn’t hold at that level.
XLM/USD 12-hour chart
The previous resistance trendline at $0.29 which now coincides with the 50-SMA is a support level. Failure to hold this point will drive XLM price down to $0.235.
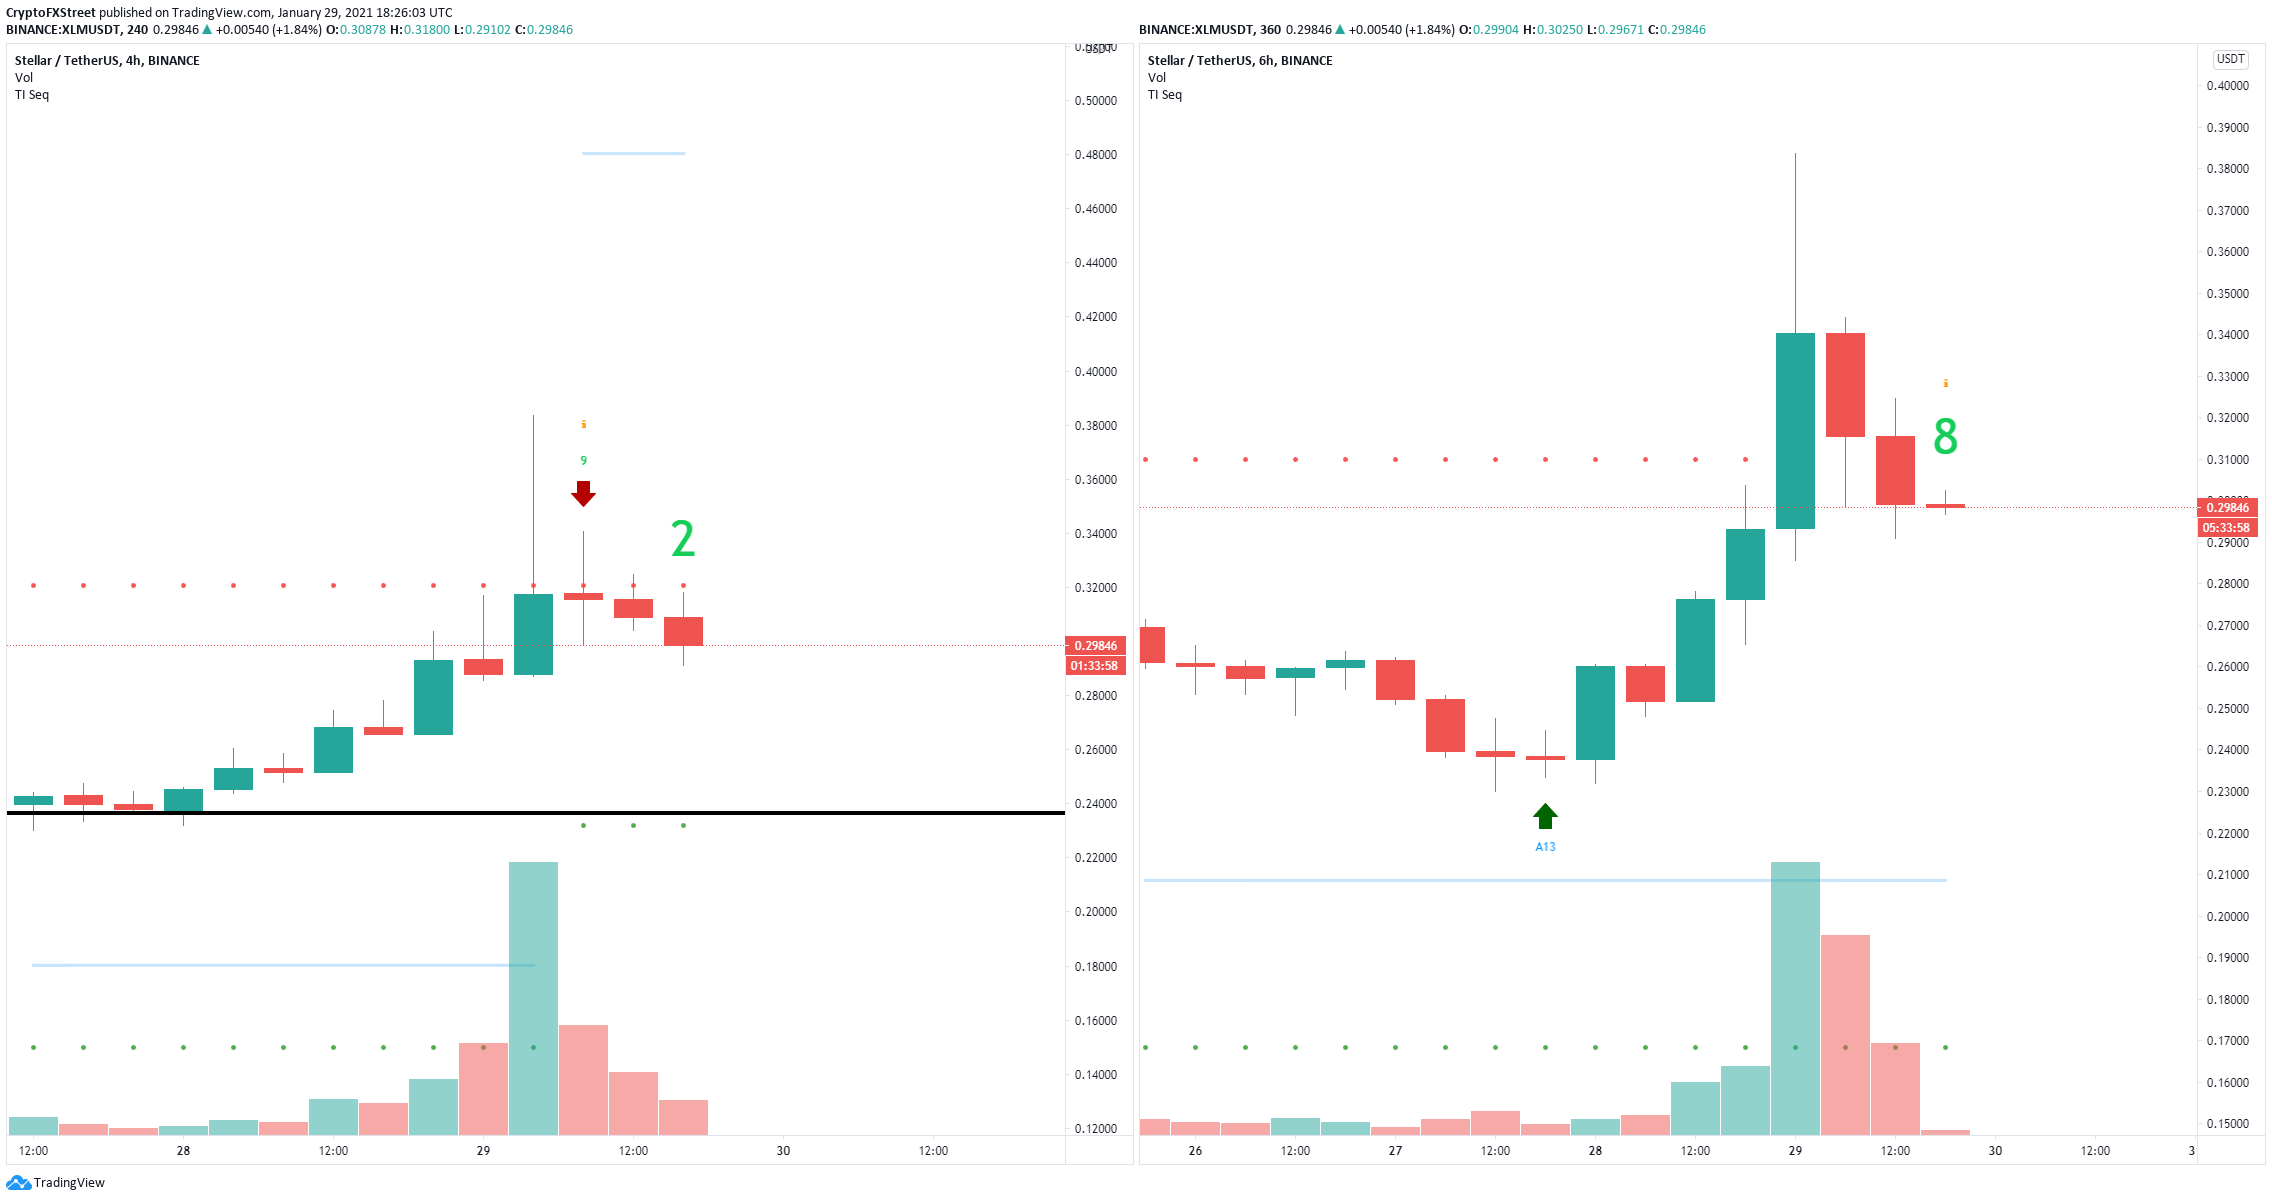
XLM sell signals
Additionally, the TD Sequential indicator has presented a sell signal on the 4-hour chart which had a lot of continuation and it’s about to exhibit the same call on the 6-hour chart, adding even more credence to the bearish outlook.
However, despite the significant crash in the past 24 hours, if the bulls can defend $0.29, the price target remains at $0.38 in the long-term.


