- XLM price reveals the largest weekly decline since Stellar began trading.
- Stellar recovered ascending channel’s lower trend line after big intra-day rebound.
- Daily Relative Strength Index (RSI) has not reached an oversold reading.
XLM price flashed warning signs for days before yesterday’s collapse that erased over 60% of its value at the intra-day low. The near-term outlook for Stellar is neutral as long as it remains above the channel’s lower trend line.
XLM price rebound to be tested by technical realities
From May 10 to May 16, XLM price was defined by indecision framed by two shooting star candlesticks above the ascending channel’s upper trend line. The marginal new high on May 16 established a double top pattern on the daily chart that was triggered yesterday with the decline below $0.550, resulting in a 53% decline on an intra-day basis.
The bearish resolution of the channel was prefaced by a bearish momentum divergence on the daily and weekly Relative Strength Indexes (RSI) at the April high.
XLM price did print a bullish hammer candlestick on the 4-hour chart yesterday triggered by the following candlestick. However, Stellar has not continued the rebound, falling back to the ascending channel’s lower trend line today.
The near-term outlook for XLM price is neutral at best, with the channel’s lower trend line serving as the bulwark against another wave of selling pressure. A decline below the trend line will prompt a test of the intersection of the 200-day simple moving average (SMA) at $0.344 with the 61.8% Fibonacci retracement level at $0.346. The retracement level corresponds to the Stellar rally beginning in September 2020 and ending at the May 16 high.
A failure to hold the critical support level would leave XLM price exposed to a test of yesterday’s low at $0.300 and possibly lower prices if the cryptocurrency complex experiences renewed selling pressure.
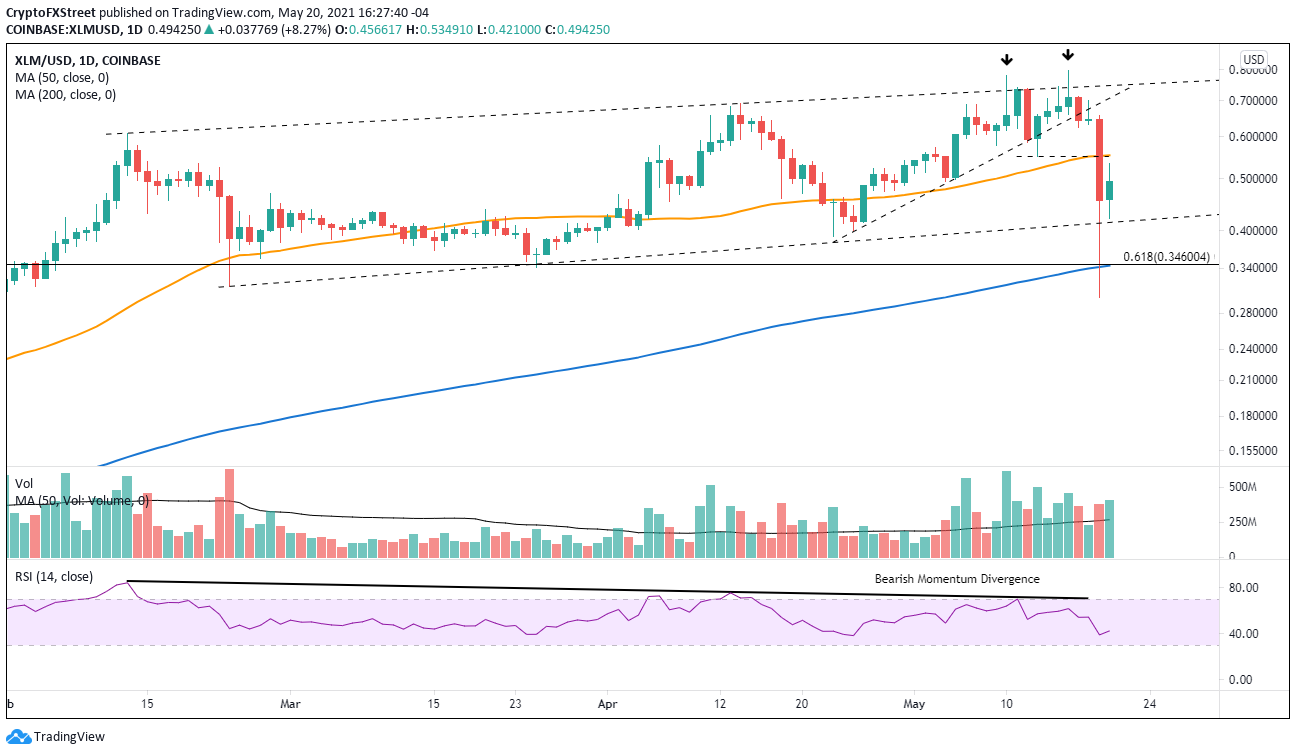
XLM/USD daily chart
Upside opportunities for Stellar are limited to the confluence of the 50-day SMA at $0.553 with the double bottom trigger at $0.550.
