- Ripple price continues to trade horizontally around 0.734.
- Ripple granted access to Binance records as the Ripple v. SEC case takes a new turn.
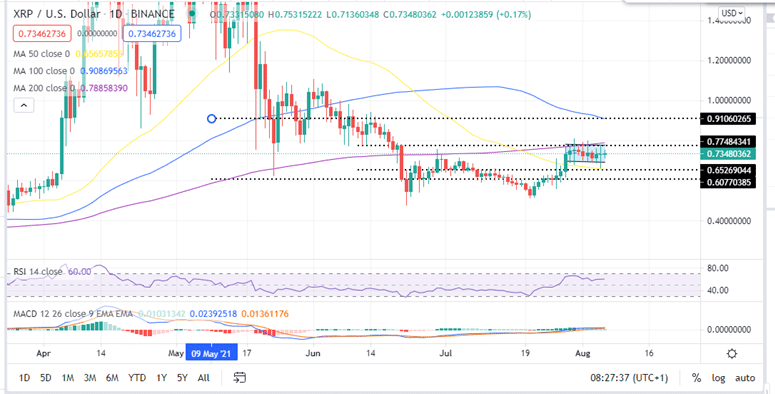
- XRP surge upwards hindered by the 200-SMA.
The Ripple price has been rejected by the 200-day Simple Moving Average (SMA) since July 28. A break above this level will trigger buy orders that will see XRP go above the $0.80 psychological level to tag new highs.
The Ripple CEO Granted Access to Binance Data
The SEC v. Ripple case took a new turn this week when the company was granted access to Binance records.
On August 03, the U.S. Magistrate Judge Sarah Netburn granted Brad Garlinghouse , Ripple CEO’s motion to “obtain international discovery” of Binance records. According to the Notice of Motion, Garlinghouse’s lawyers had requested the court to compel Binance to:
“… produce documents so that the Mr. Garlinghouse can receive evidence before the close of fact discovery.”
According to the docket, the request was granted on Tuesday and read:
“ORDER granting 274 Letter Motion for Discovery. The Court will communicate with counsel to arrange delivery of the letters.”
Note that the records may provide crucial evidence that Brad Garlinghouse was acting outside SEC’s jurisdiction.
The SEC filed a suit against Ripple Labs in December 2020, accusing Garlinghouse and his co-founder Larsen of conducting “unregistered, ongoing digital asset securities offering” with their XRP token sales.
These news caused Ripple price to drop by 50% as traders panic sold XRP. XRP has since recovered reaching around $2 in April before the May downswing. At the time of writing, Ripple is exchanging hands at $0.734 on most crypto exchanges.
Ripple price trades in a tight range between $0.693 and the 200-day SMA
XRP price action has been uneventful over the past one week. This is validated as the horizontal price action and yesterday’s doji candlestick, indicating market indecision. Since July 29, the Ripple has been hovering between the %0.693 support wall and the 50-day SMA.
The horizontal movement of the Ripple price is accentuated by the horizontal movement of the (Moving Average Convergence Divergence (MACD) indicator close to the midline. Moreover, the horizontal movement of the Relative Strength Index (RSI) also shows that the pressure from bulls and bears is cancelling out.
Ripple Price (XRP/USD) Daily Chart
Which Way XRP?
If you wish to buy XRP you should note that Ripple needs to overcome the 200-day SMA at $0.79 to bolster bulls to propel the international remittances token to areas around the 100-day SMA at $0.910 or the $1 psychological level.
On the downside, if Ripple price falls below the $0.693 support wall, it could trigger selling orders that could push Ripple down to re-test the 50-SMA at $0.652 and the $0.607 support levels respectively.
Looking to buy or trade Ripple now? Invest at eToro!
Capital at risk
