- Yearn.Finance price is currently trading inside a parallel channel on the 12-hour chart.
- It seems that large holders have been taking a lot of profit in the past two weeks, increasing selling pressure.
- If the bulls can’t hold a critical support level, YFI can quickly fall below $20,000.
Yearn.Finance has been trading between a defined range from $40,000 down to $26,000 for the past two weeks. The digital asset has lost a lot of strength as whales have exited the network. Bulls must defend a crucial support level to avoid another leg down.
Yearn.Finance price on the verge of crashing
On the 12-hour chart, YFI has established a parallel channel with its lower trendline located at $28,000. A breakdown below this point would drive Yearn.Finance price down to $23,000 initially and as low as $17,000 in the long-term.
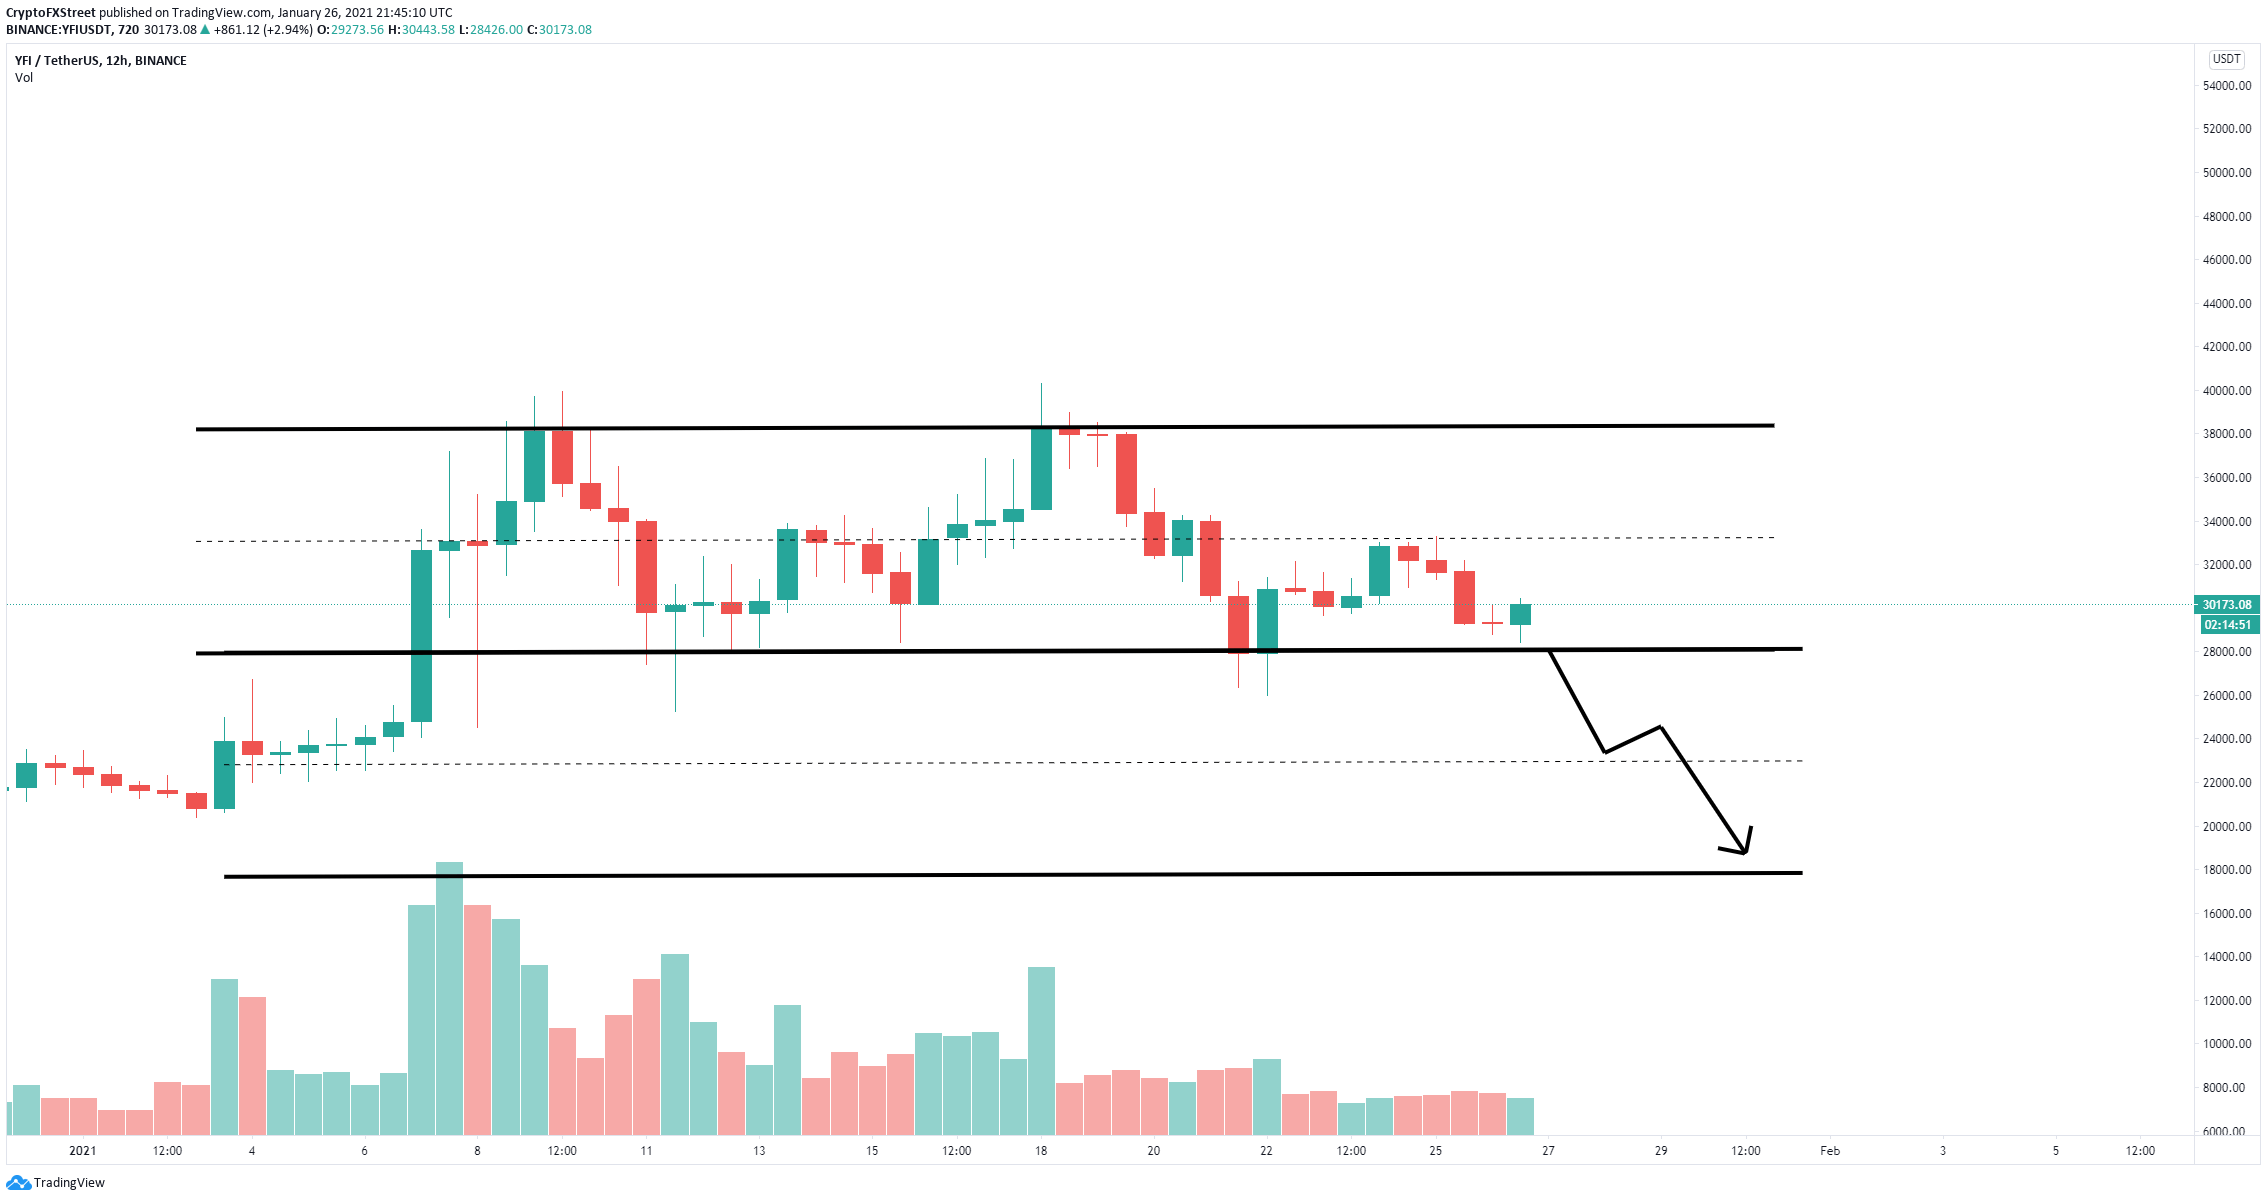
YFI/USD 12-hour chart
The In/Out of the Money Around Price (IOMAP) chart shows a strong barrier above $30,000 and until $34,000. The only significant support area seems to be located between $27,400 and $28,400 which coincides with the lower trendline of the parallel channel.
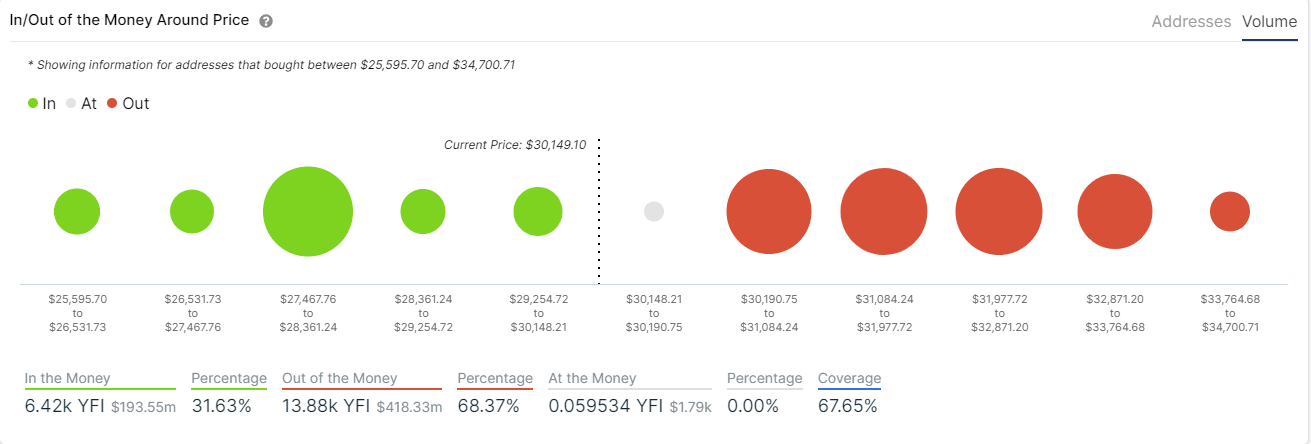
YFI IOMAP chart
The number of whales holding between 100 and 1,000 YFI coins peaked at 42 on January 20 before plummeting down to 37 currently. Similarly, the amount of large holders with 10-100 coins also dropped from 158 on January 14 to a current low of 140. This indicates that large investors are taking profits and exiting.
%20%5B22.47.36,%2026%20Jan,%202021%5D-637472945247788304.png)
YFI Holders Distribution chart
The only chance for the bulls is to defend the $28,000 support level and see a rebound towards the middle trendline of the parallel channel at $33,000.
