- YFI price is up by 132% in the past five days but seems to be topping out.
- Several indicators have flipped bearish indicating that YFI could be on the verge of a retrace.
YFI price had a massive 132% rally that started on November 5 from a low of $7,451 reaching a current price of $17,913. It seems that the digital asset is topping out and looking for a healthy pullback in the short-term.
YFI faces a potential sell signal on the 4-hour chart
It’s not surprising to see YFI topping out after a significant 132% rally. On the 4-hour chart, the TD Sequential indicator has presented a green ‘8’ signal which is usually followed by a ‘9’ sell signal.
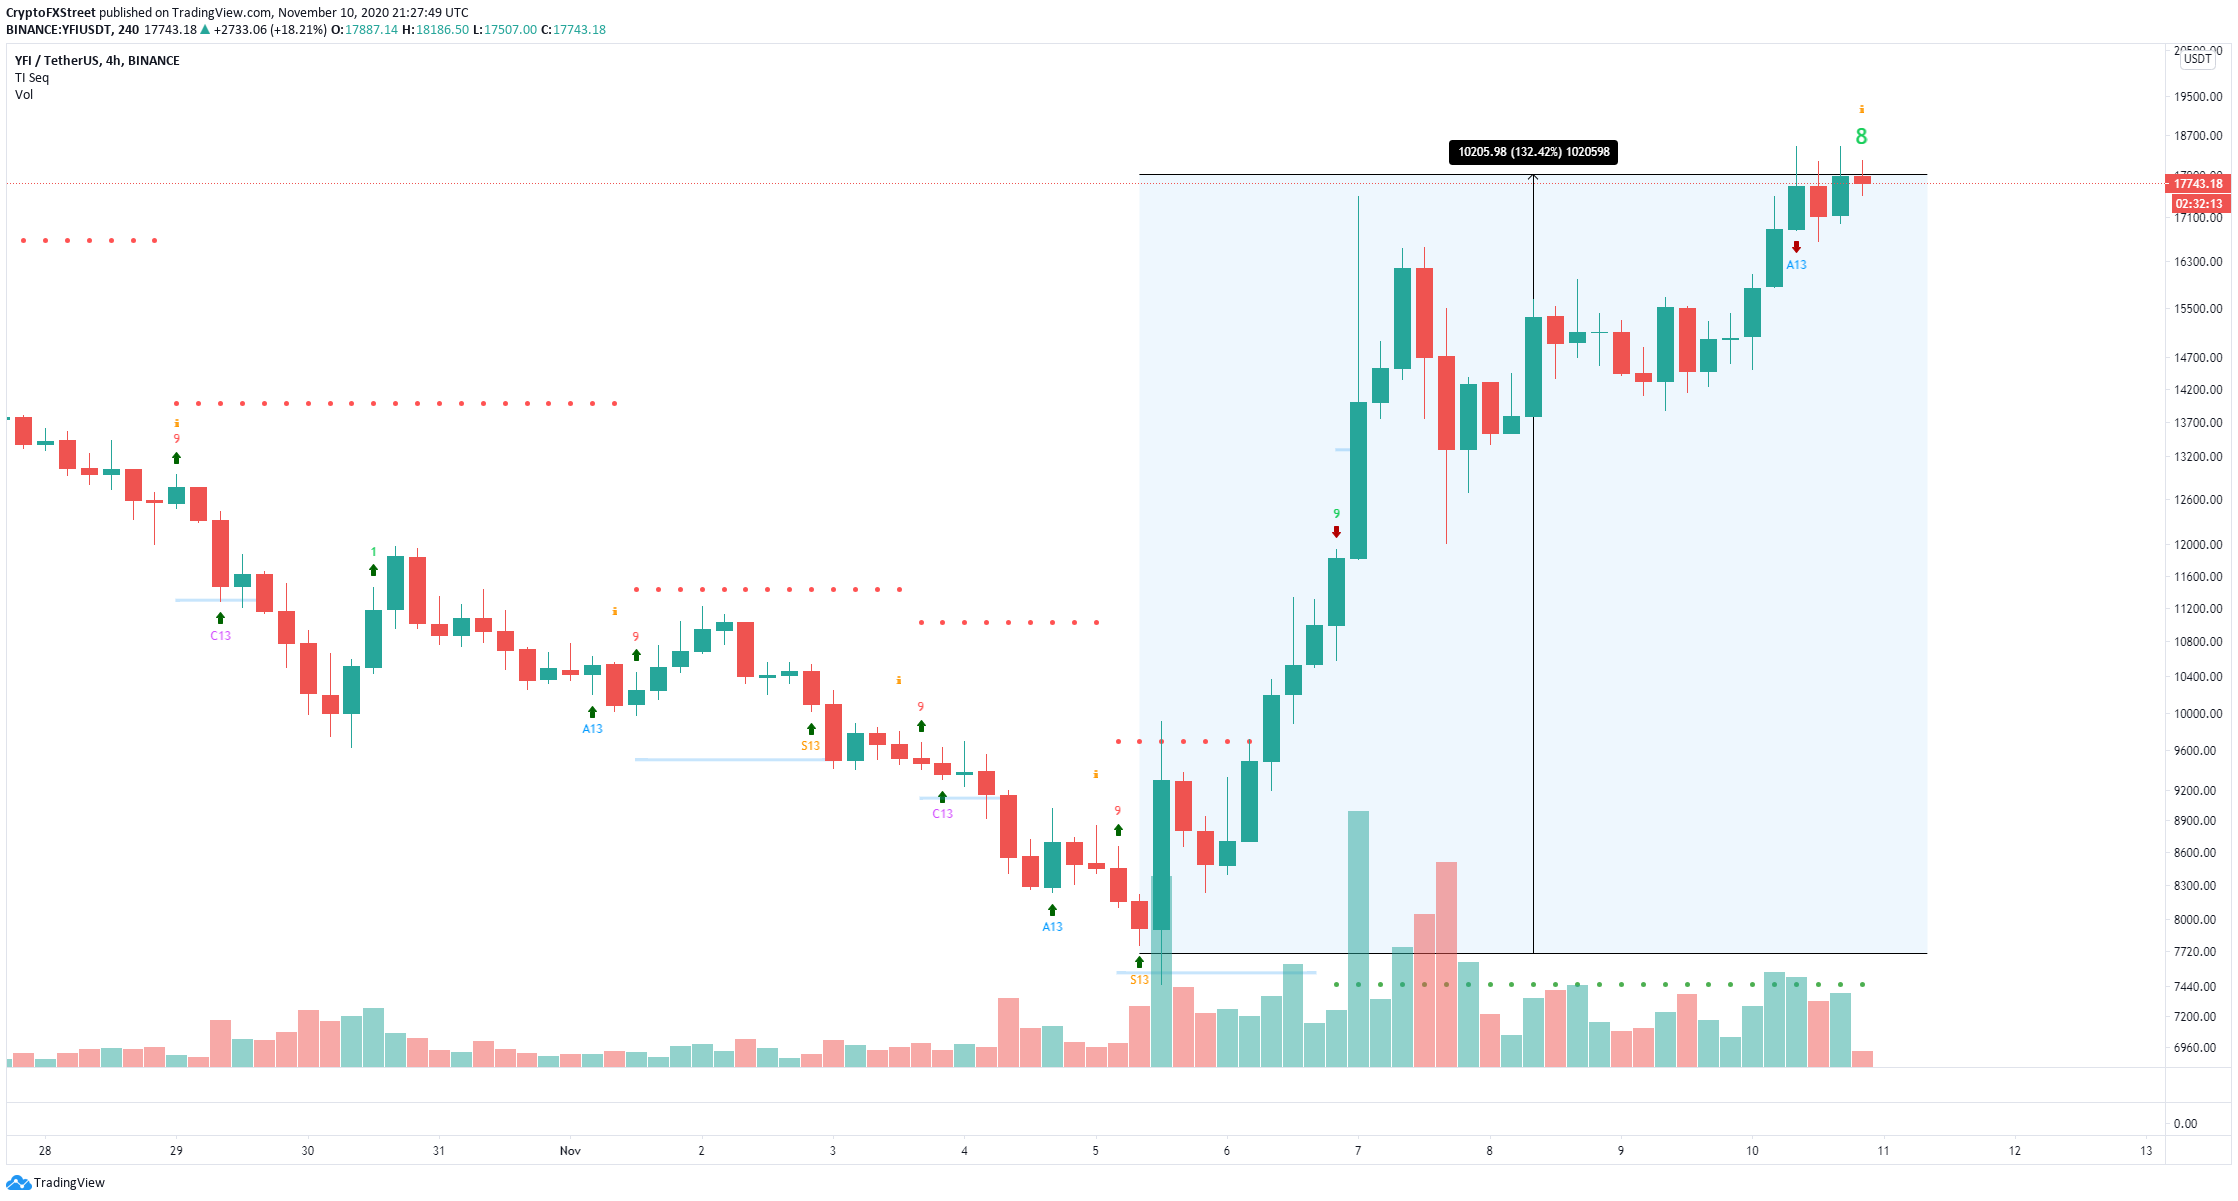
YFI/USD 4-hour chart
The In/Out of the Money Around Price shows a similar story with the most significant support area between $15,086 and $15,639 which means that the validation of the sell signal has the potential to drive YFI price towards $15,086 as an initial price target.
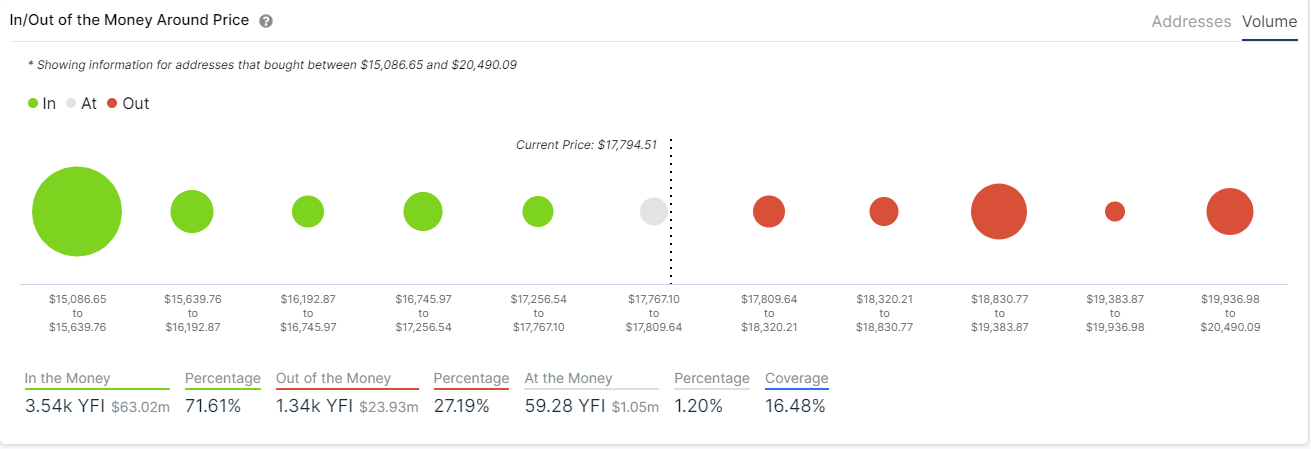
YFI IOMAP chart
On the other hand, the same chart also shows very little resistance ahead with the most notable resistance area between $18,830 and $19,383. A breakout above the high at $18,465 would drive YFI price to $20,000 according to the IOMAP chart.
