- Zcash has been under consolidation for the past two weeks and it’s ready for a move.
- The digital asset is trading inside a symmetrical triangle pattern on the 4-hour chart.
- There are two key levels that investors are looking at, which can send Zcash price up or down 37%.
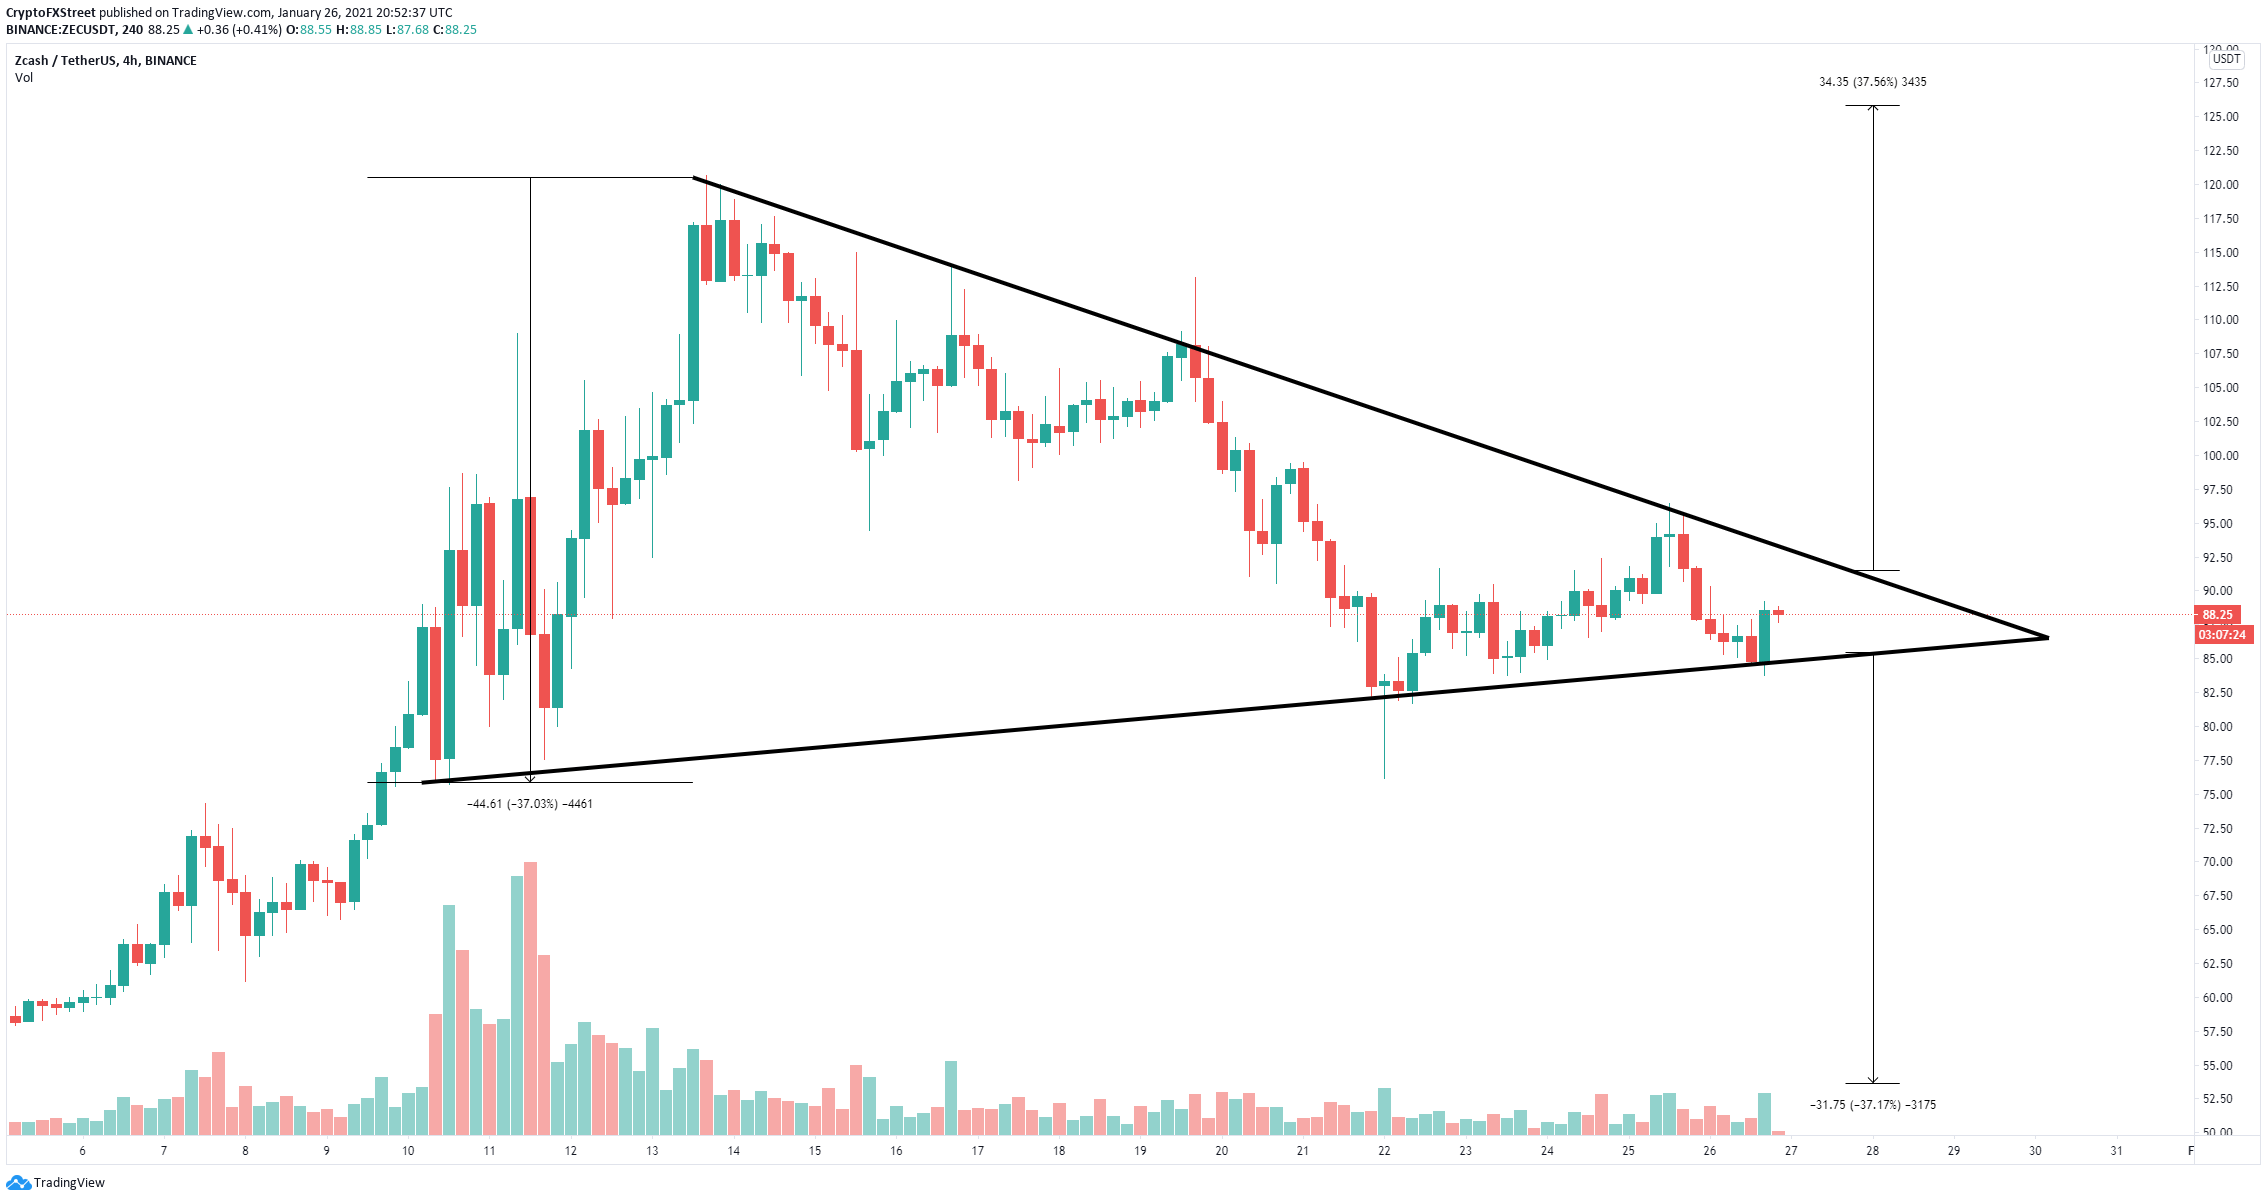
Zcash had a significant run to $120 on January 13 and has been under consolidation since then. The digital asset has established a tightening pattern on the 4-hour chart which seems to be on the verge of breaking.
Zcash price aims for a massive move if these levels break
On the 4-hour chart, the symmetrical triangle pattern is the most notable pattern in the short-term. The support trendline is formed at $84, which means that a breakdown below this point would send Zcash price towards $54, a 37% move.
ZEC/USD 4-hour chart
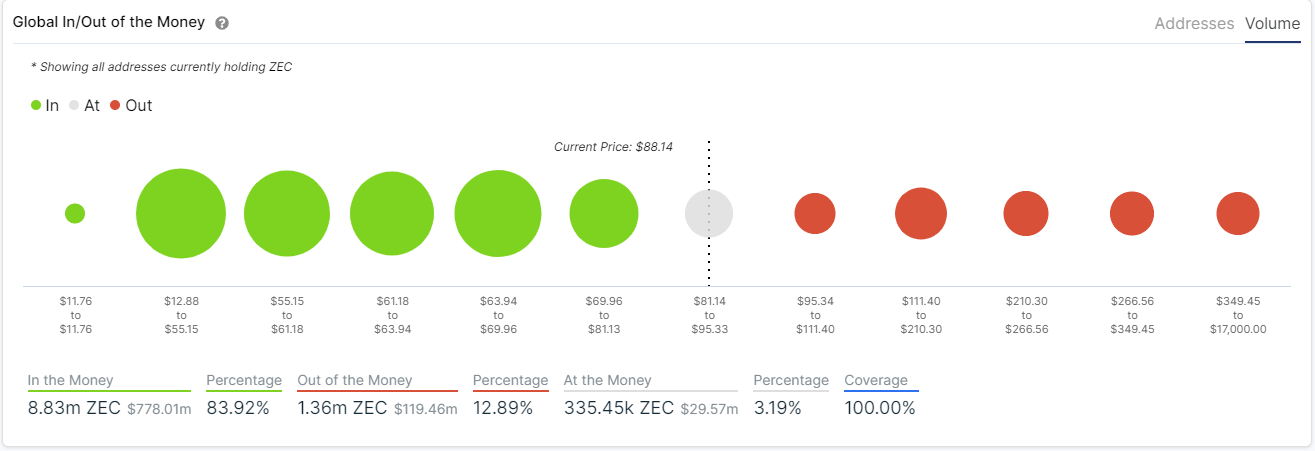
However, if we look at the Global In/Out of the Money (GIOM) chart, there seems to be a lot of support below $90 compared to the resistance above. The resistance trendline is located at $92, and the GIOM model shows a weaker barrier between $95 and $111, with only 184,000 ZEC held by 15,350 addresses.
ZEC GIOM chart
Between $70 and $81, the support area has 1.04 million ZEC held by 50,320, which is significantly higher. A breakout above $92 would quickly push Zcash price towards $126, a 37% move.


