- ZEC is currently trading at $59 after defending the daily 200-MA and $56 support level.
- Bulls are now fighting to stay above the daily 200-EMA at $59.81.
Zcash had one of the worst crashes in the market, losing more than 25% of its value in just one day. ZEC bulls are trying to recover after bouncing from the daily 200-MA as there aren’t many resistance levels on the way up.
ZEC/USD daily chart
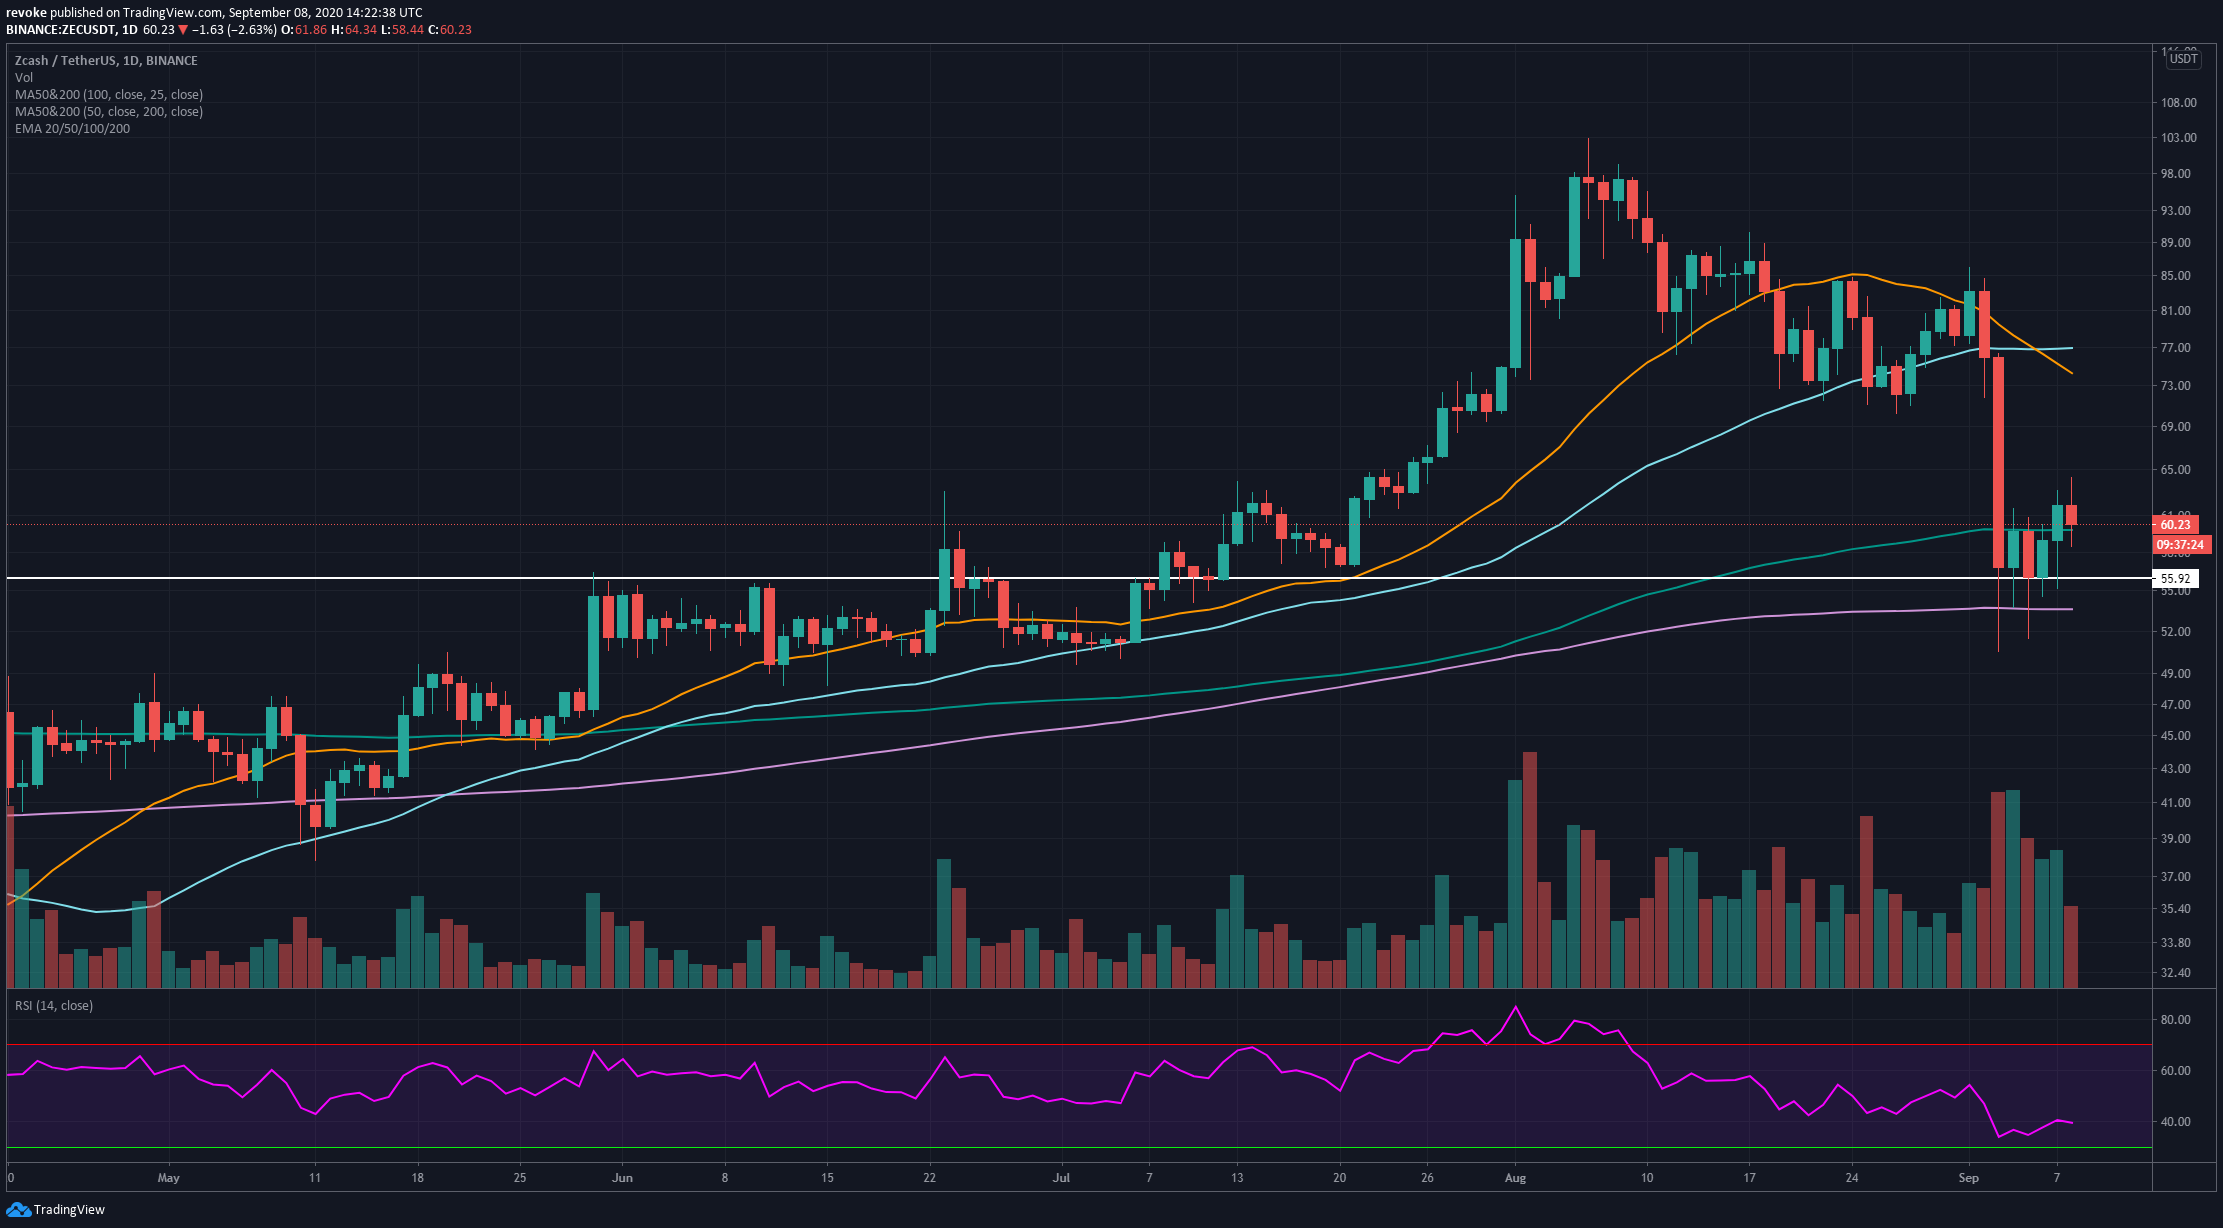
The initial crash took ZEC price as low as $50.56, and bulls managed to establish a healthy support level around $56. The price of Zcash has bounced several times from that level and the daily 200-MA, currently at $53.59.
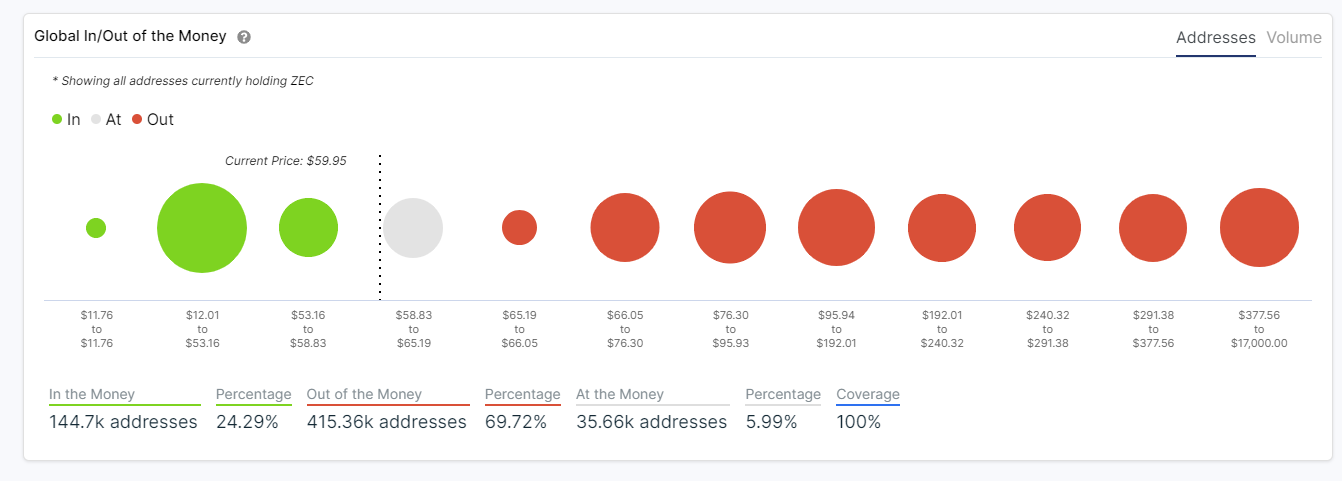
The $56 support level is crucial because many addresses bought around that level. According to the IOMAP model, $56 and $42 are the most critical support levels. As for resistance, bulls will encounter a strong level at $71 and $83.
ZEC/USD 4-hour chart
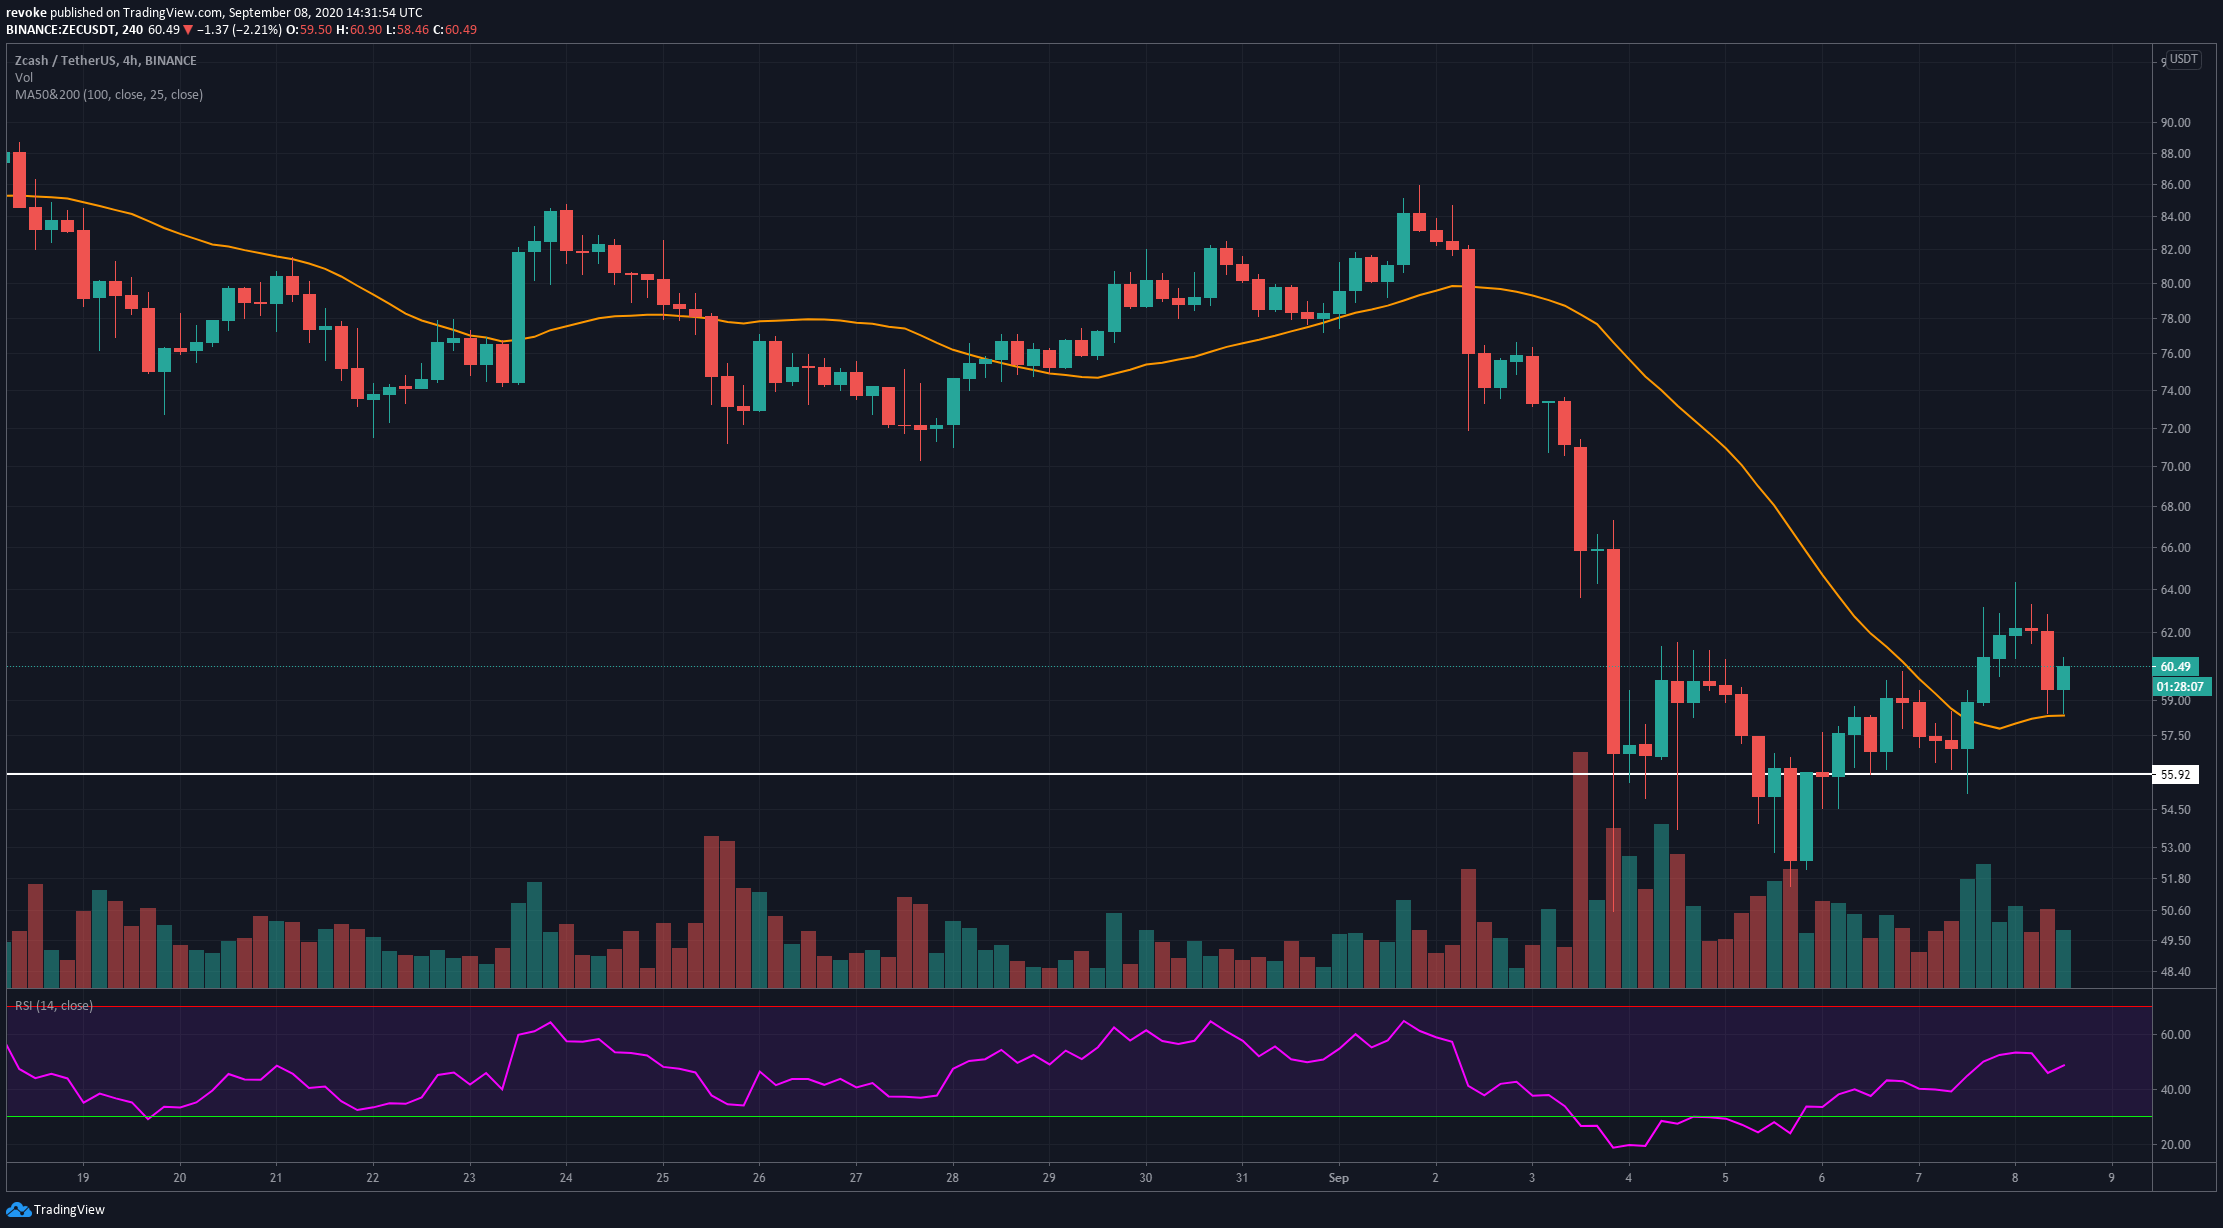
The 4-hour chart is now in an uptrend after bulls formed a low at $51.5, followed by a higher low at $ 55.14. ZEC buyers also managed to climb above the 100-MA at $58.35. The RSI remained overextended for around two days before the bounce, and it’s now hovering 50 points. The next short-term resistance point is located at $64.34, the high of the last four days.
