- Zilliqa price is trading inside an ascending parallel channel on the 4-hour chart.
- The digital asset is right in the middle of the pattern and awaits a clear breakout or breakdown.
Zilliqa price has been trading in a short-term uptrend since the beginning of November and it’s close to the 2020-high of $0.036 again. The digital asset needs to see a clear breakout to hit a new high by the end of 2021.
Zilliqa price keeps the bullish momentum
After defending the lower trendline of the ascending parallel channel on the 4-hour chart, the bulls managed to push Zilliqa price above the 50-SMA and the 100-SMA, turning both into support levels and keeping control of the trend.
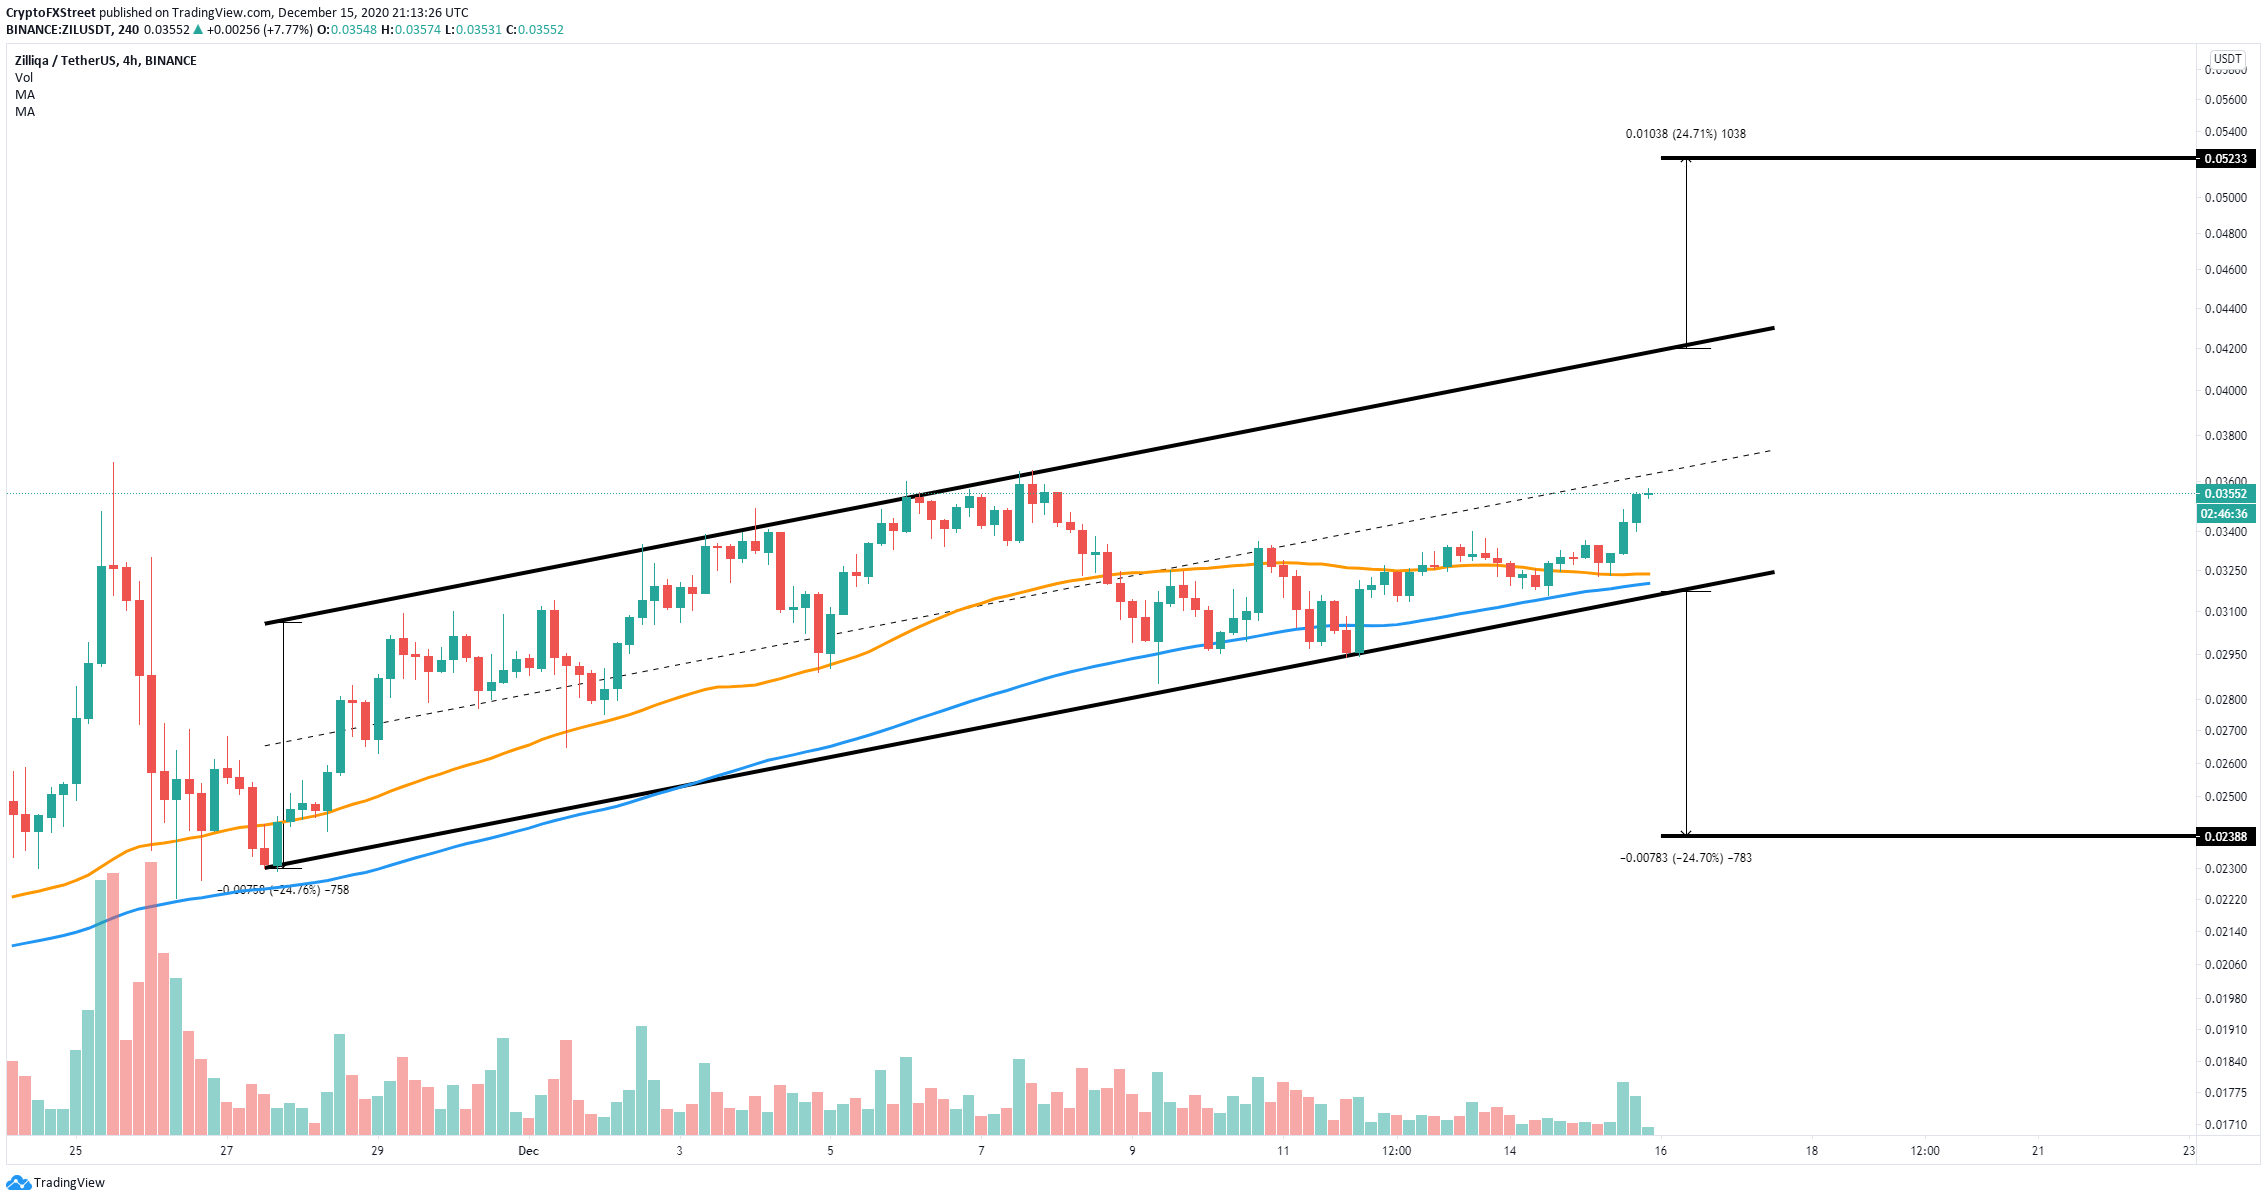
ZIL/USD 4-hour chart
The digital asset has bounced notable from the bottom of the pattern and aims for the upper trendline at $0.042. A breakout above this level would quickly push ZIL towards $0.052 in the long-term.
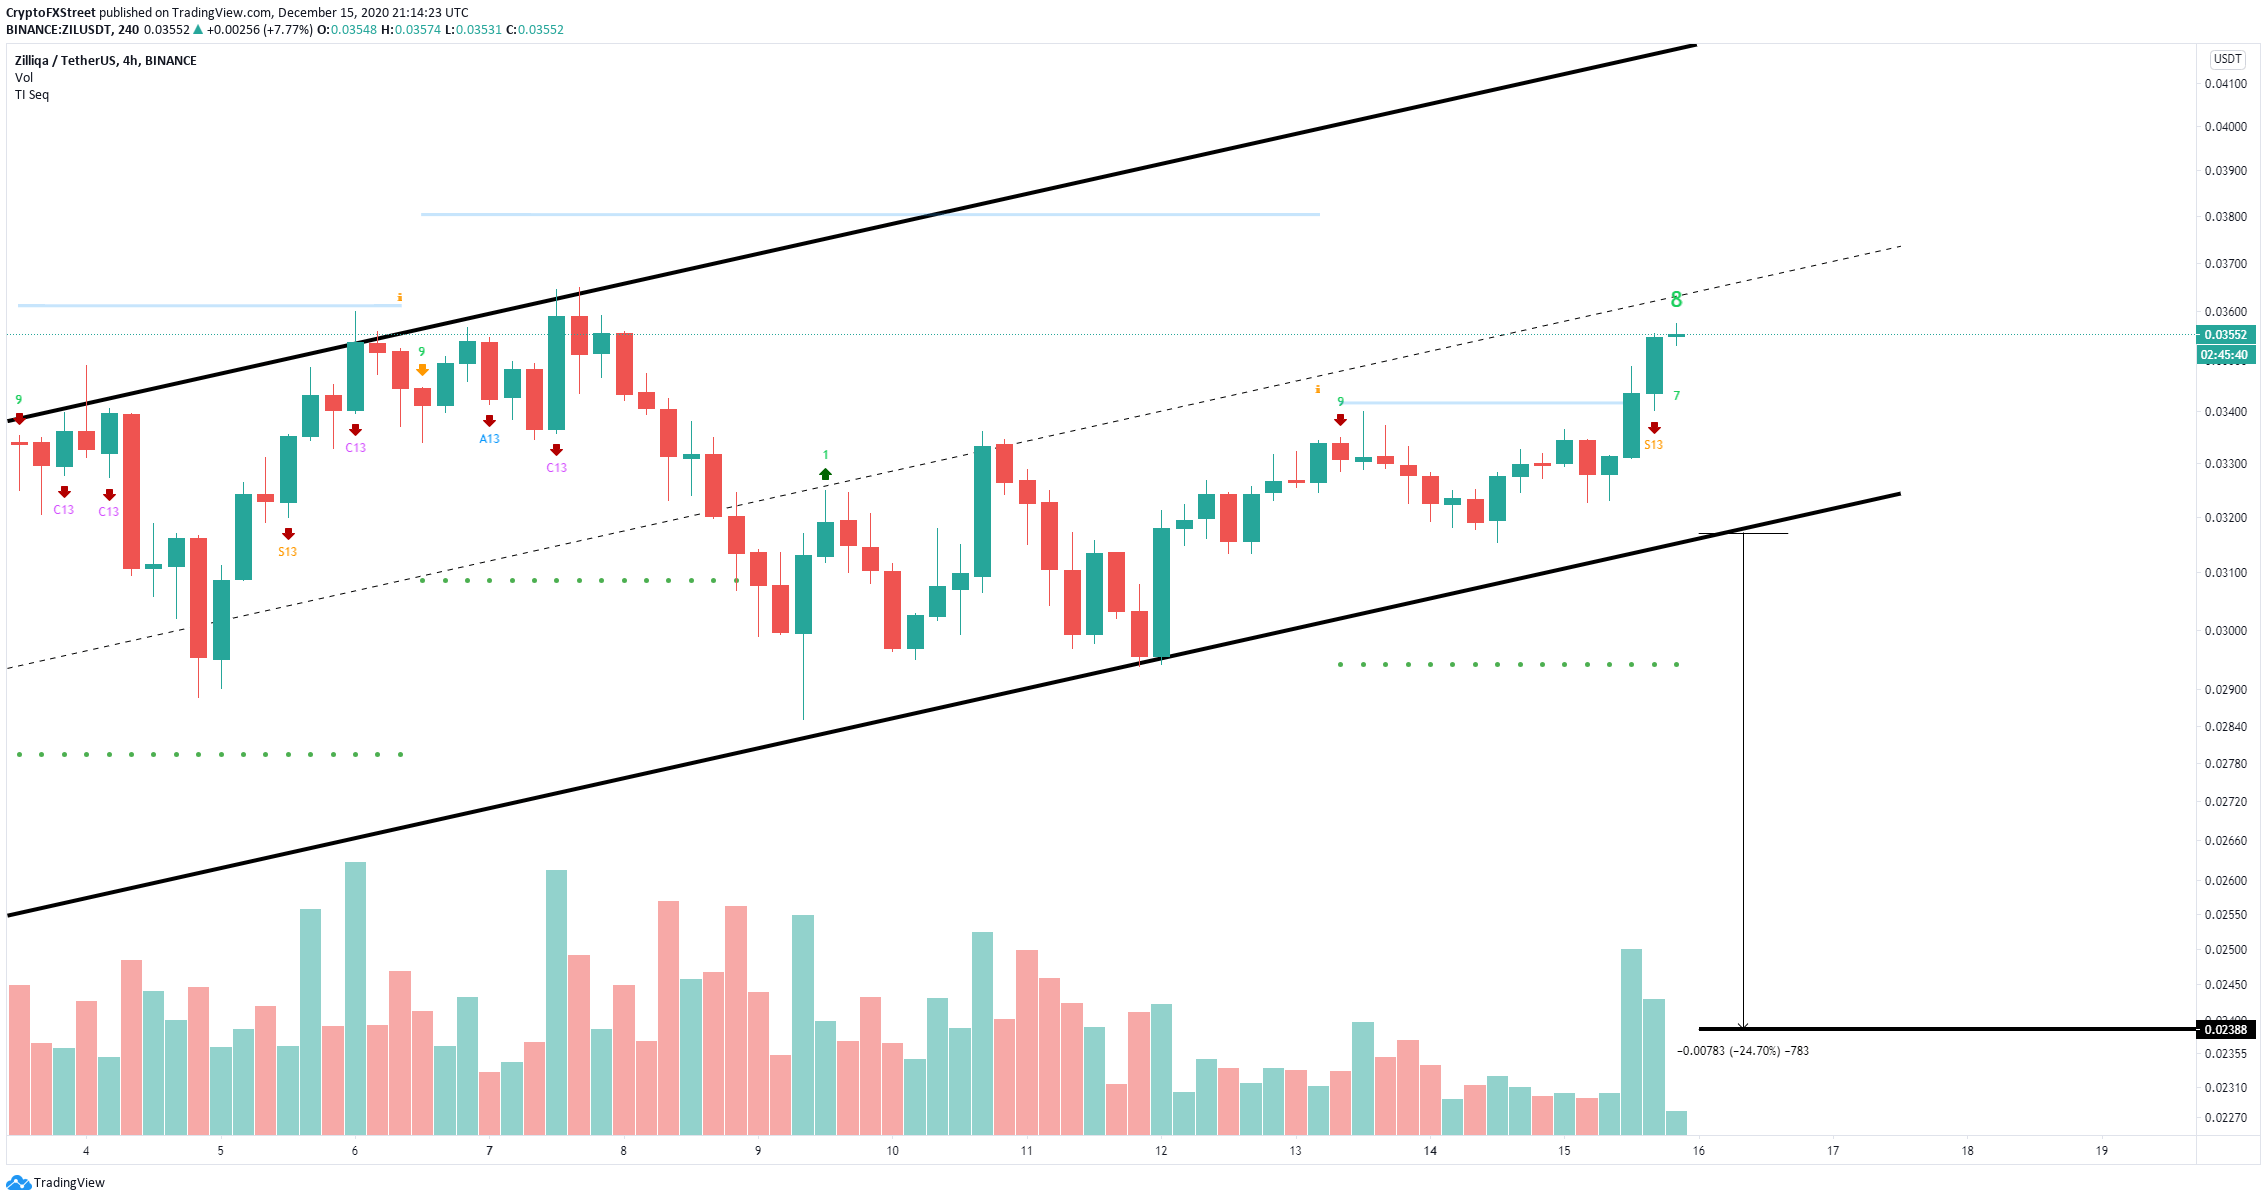
ZIL/USD 4-hour chart
On the other hand, the TD Sequential indicator is on the verge of presenting a sell signal in the form of a green ‘9’ candle on the 4-hour chart. Validation of this call can drive ZIL towards the lower trendline of the pattern. A breakdown below $0.031 can push Zilliqa price to $0.023.
