- Zilliqa price breaks out of a bullish pennant formation, indicating an uptick in buyers.
- A 60% upswing to $0.21 can be expected if ZIL forms a higher high at $0.15.
- The sell signal from the Tom DeMark (TD) Sequential indicator could deter this bull rally or even invalidate it.
Zilliqa price has broken out of a bullish consolidation pattern suggesting a potential 60% upswing shortly. However, a specific technical indicator’s sell signal hints that this uptrend will not be a walk in the park.
Zilliqa price eyes a lower low
Zilliqa price has established a series of lower highs and higher lows since February 13, forming a pennant. However, considering the 168% upswing seen between January 27 and February 12 as a “flag pole,” ZIL seems to be traversing a bullish pennant.
This continuation pattern forecasts a 60% bull rally to $0.21, determined by adding the flag pole’s height to the breakout point at $0.13. Although ZIL has sliced through the key level at $0.13, a decisive close above $0.150 is a must. Such a price action creates a higher high confirming the resurgence of bullish momentum.
Adding credence to this bullish outlook is the SuperTrend indicator’s buy signal flashed due to the 11% surge in the current12-hour candlestick.
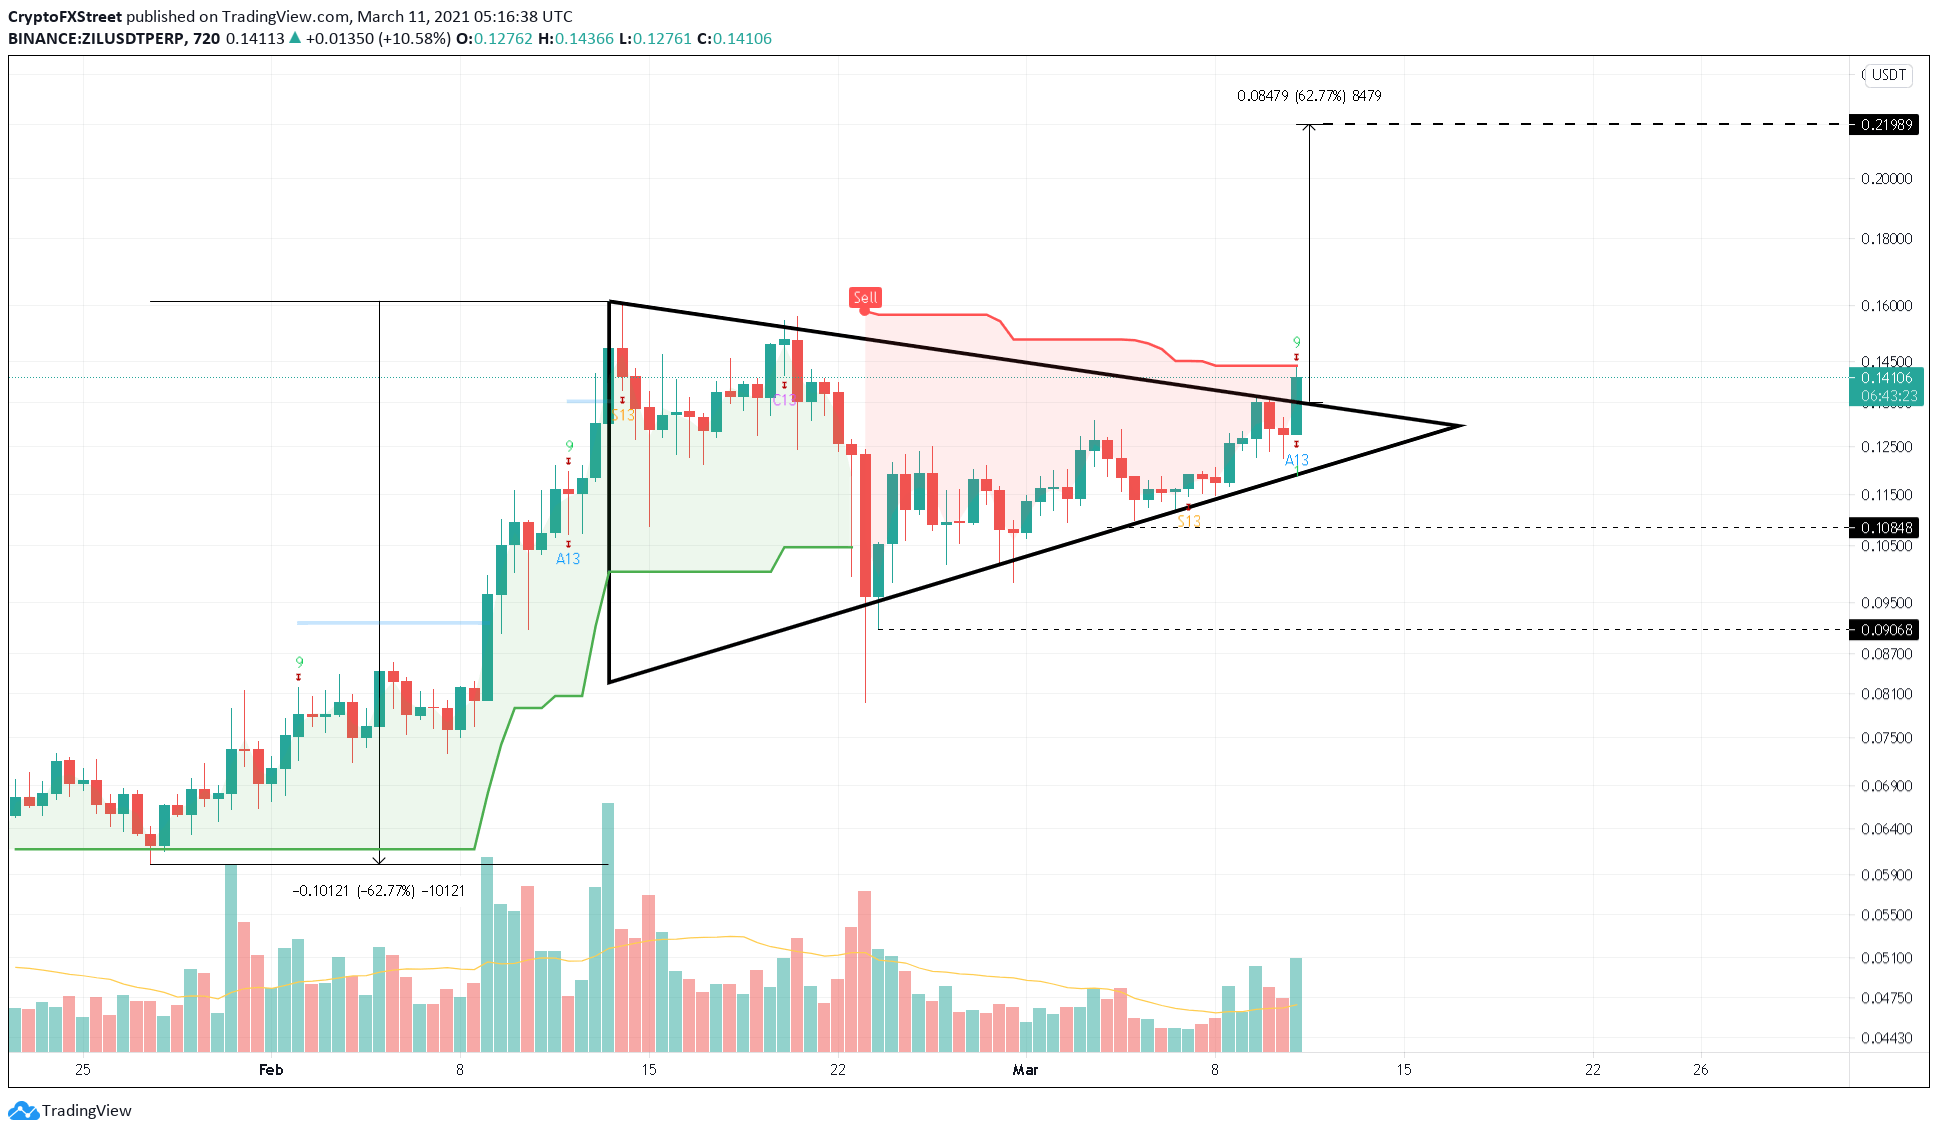
ZIL/UDT 12-hour chart
While the overall outlook for ZIL is bullish, investors should note that the TD Sequential indicator has presented a “sell signal” in the form of a green nine candlestick on the 12-hour chart. This setup forecasts a one-to-four candlestick correction, which could put the upswing in jeopardy, especially if Zilliqa price re-enters the pennant.
However, a decisive close below the recent low at $0.10 could spell disaster for ZIL as it could result in a 15% pullback to 0.090.
