- Zilliqa price bounces over 100% from the May 23 low, but volume lags.
- 200-day simple moving average (SMA) has played a role of support or resistance over the previous seven days.
- ZIL daily Relative Strength Index (RSI) reached the most oversold reading since March 2020.
Zilliqa price has stalled at the May declining trend line after setting the framework for a double bottom on the daily chart. Volume has not been cooperative during the rebound, suggesting that a pullback or pause is necessary to refresh ZIL after the 100% bounce from the May 23 low.
Zilliqa price boasts clear points of support for any future weakness
Zilliqa price declined over 70% from the all-time high at $0.262 to the May 23 low at $0.069. The decline followed several failed attempts to overcome the 2018 high at $0.235, resulting in a double top pattern that triggered on May 19 with a fall below $0.115.
ZIL briefly identified support at the 40-week SMA, the March 2020 rising trend line and the 23.6% Fibonacci extension of the advance beginning in March 2020 at $0.085, before finally bottoming at $0.069.
Moving forward, the price range defined by the May declining trend line, currently at $0.140, and the 200-day SMA at $0.113 should contain Zilliqa price over the next few days and provide the base for higher prices.
A successful ZIL breakout above May’s declining trend line and the 61.8% retracement of the May correction at $0.155 would trigger the double bottom pattern and set Zilliqa price on the path to test the declining 50-day SMA at $0.183 and then the 78.6% retracement at $0.194.
As was the case in April and early May, the 2018 high at $0.235 will interrupt the rally. A daily close above the all-time high at $0.262, representing a 120% gain from price at the time of writing, would confirm the resistance has been solved, and Zilliqa price can begin a sustainable advance into new highs.
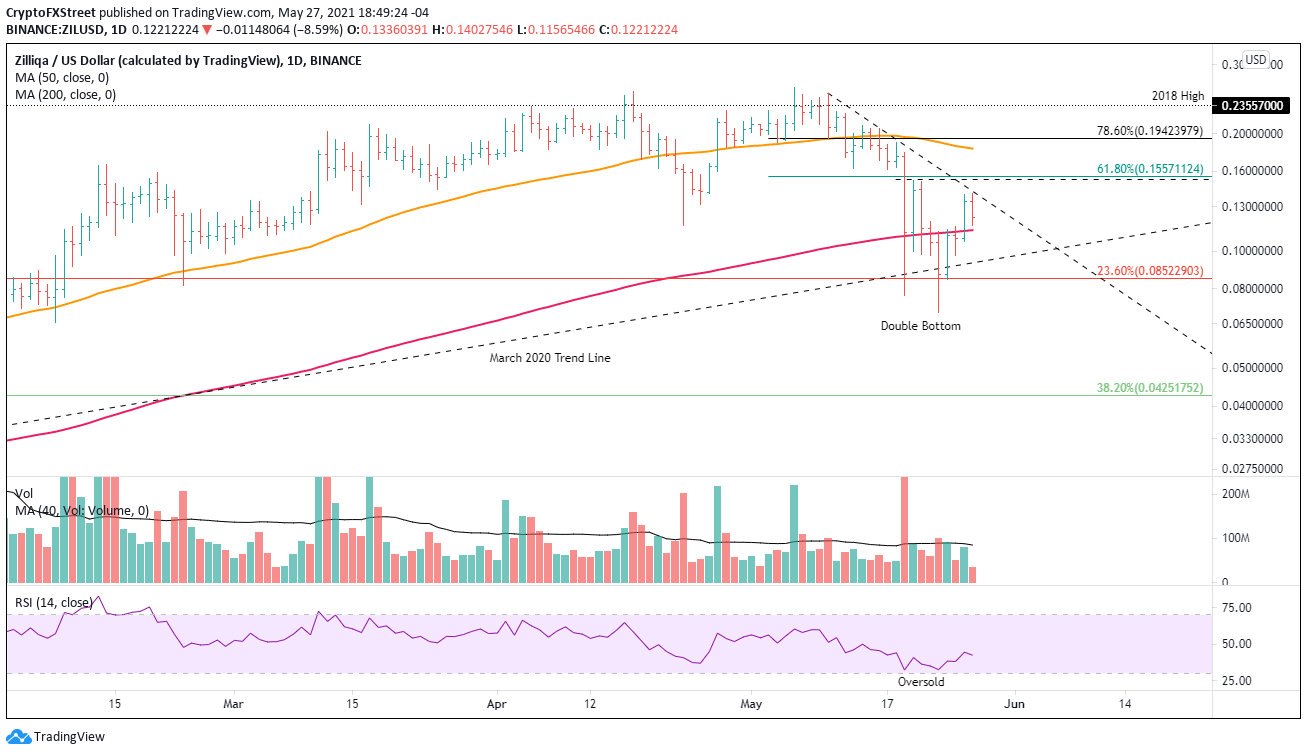
ZIL/USD daily chart
An acceleration of selling pressure below the 200-day SMA would instigate a test of the March 2020 rising trend line at $0.094. A failure to hold the trend line would push ZIL to the 23.6% retracement at $0.085.
Any further weakness would signify that Zilliqa price is entering a new phase for the correction that could push ZIL to test the 38.2% retracement of the advance beginning in March 2020 at $0.042.
