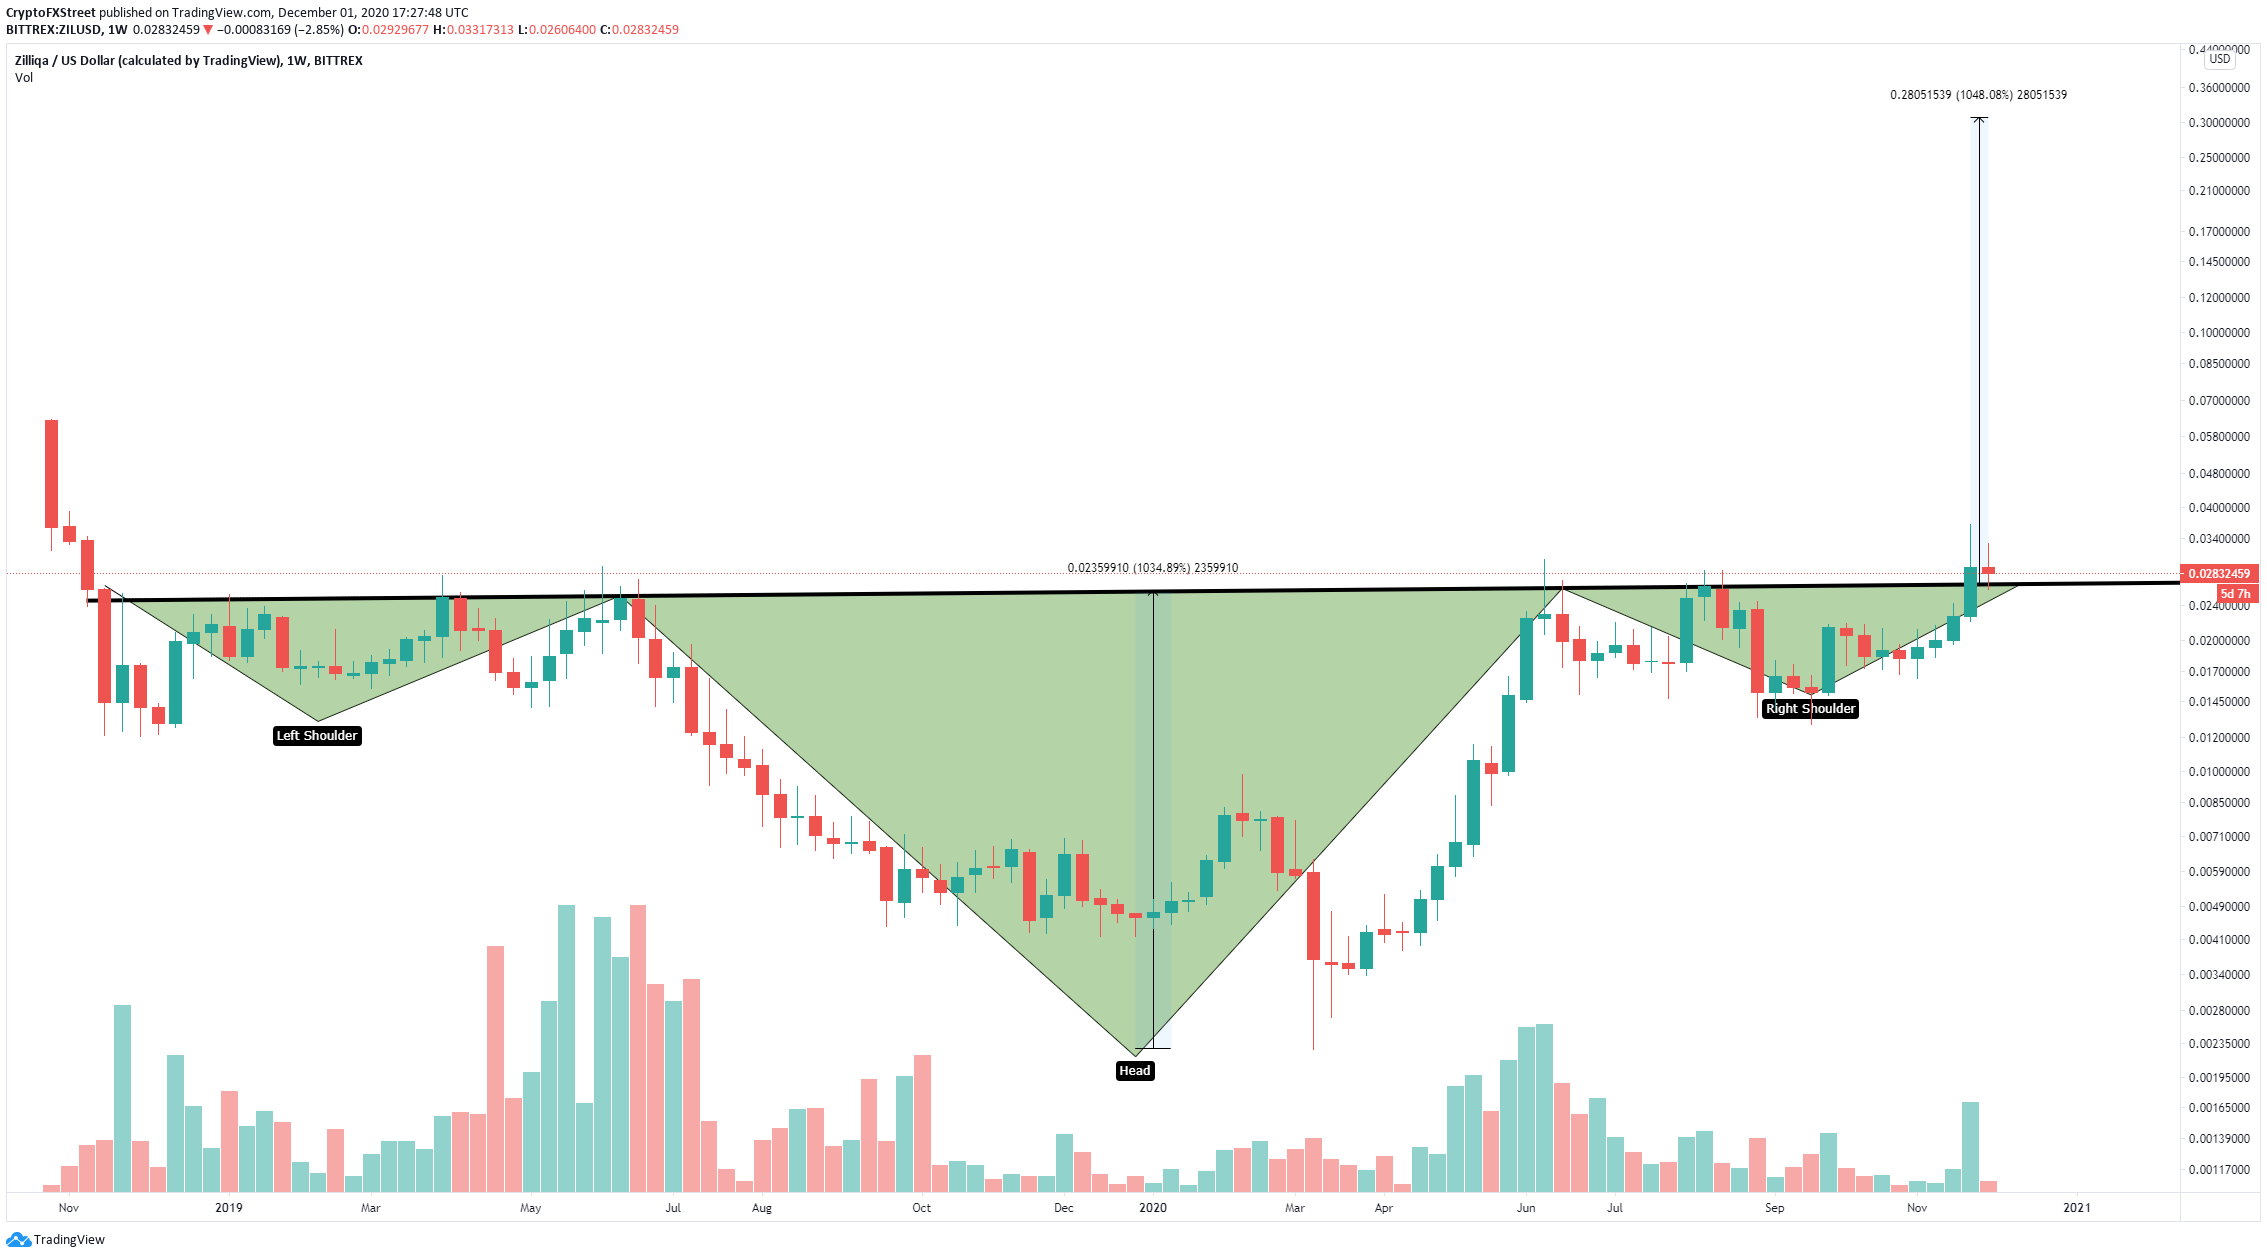
- Zilliqa price seems to be contained inside an inverse head-and-shoulders pattern on the weekly chart.
- ZIL is breaking out and aims for a massive price target at $0.3.
Zilliqa has been trading fairly sideways for the past six months and seems to be finally breaking out of a significantly bullish trading pattern. Several metrics indicate ZIL is on the verge of a massive price move.
Zilliqa price breaks out of a significant bullish pattern
On the weekly chart, ZIL formed an inverse head-and-shoulders pattern, which is a bullish pattern. The neckline resistance trendline was broken on November 23, and Zilliqa price has already re-tested it in the past week, successfully defending it.
ZIL/USD weekly chart
Using the height of the head to the neckline as a reference, it seems that Zilliqa price is aiming for a massive price target at $0.3, which would mean a 1,000% increase from the breakout at $0.027.
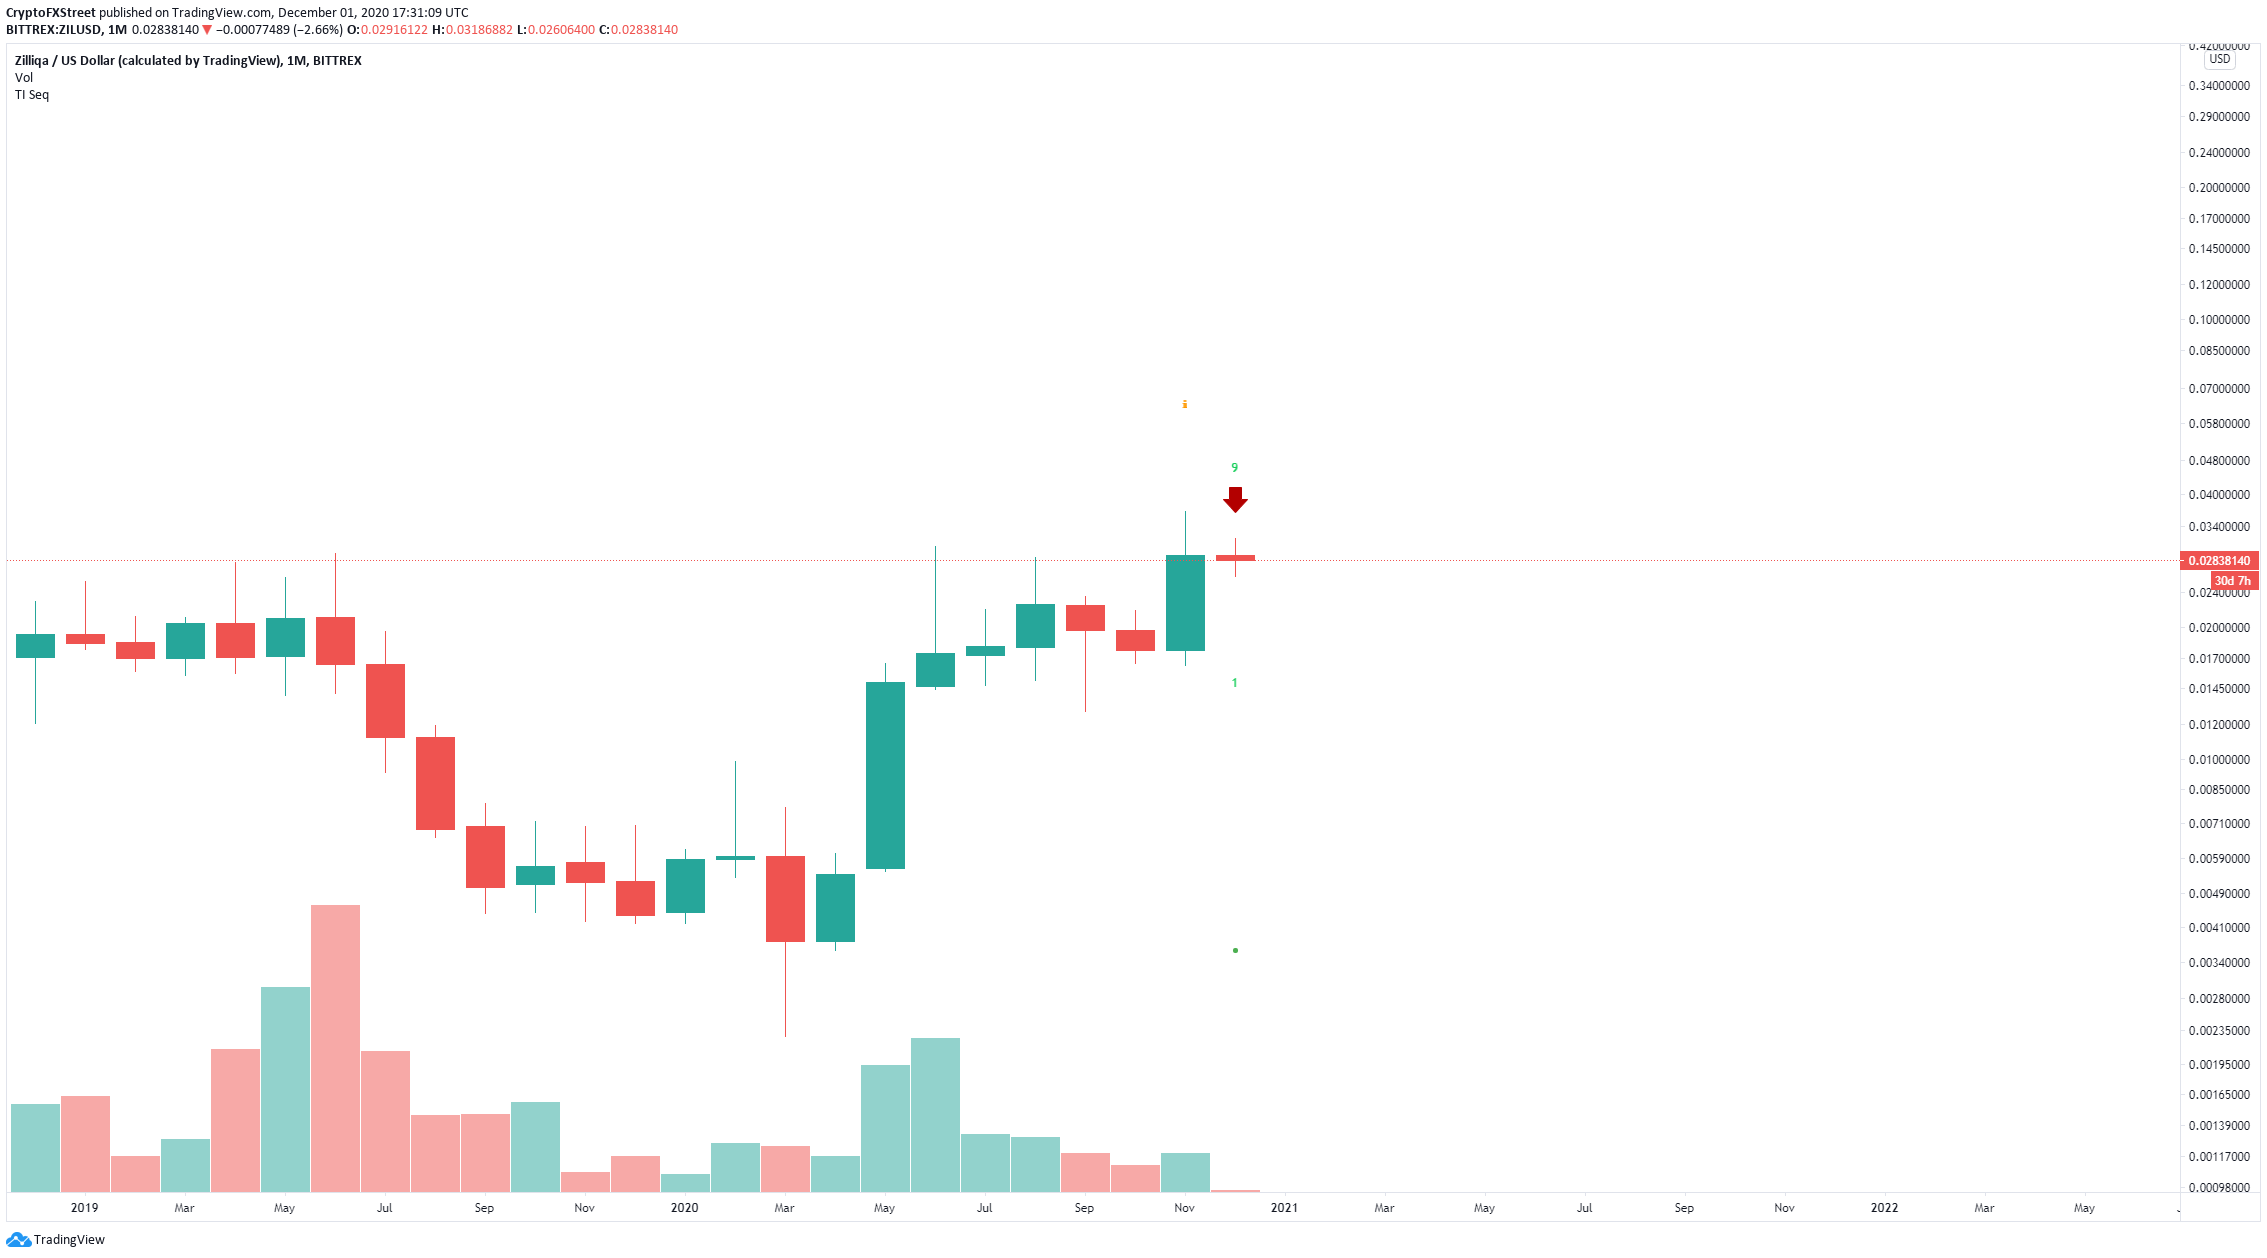
ZIL/USD monthly chart
However, despite the bullish pattern, the TD Sequential indicator has still presented a sell signal on the monthly chart. Validation of the signal could quickly drive Zilliqa price to $0.02 if the neckline support level at $0.027 is broken.


