USD/JPY finished the week strongly, as the pair gained slightly over one cent on the week. USD/JPY closed the week at 98.20. This week’s highlights are the Tankan indexes and the BOJ Monetary Policy Statement. Here’s an outlook for the Japanese events and an updated technical analysis for USD/JPY.
Japanese inflation indicators met their estimates last week. In the US, Unemployment Claims were down slightly, but key manufacturing and housing data posted declines.
[do action=”autoupdate” tag=”USDJPYUpdate”/]USD/JPY daily chart with support and resistance lines on it. Click to enlarge: 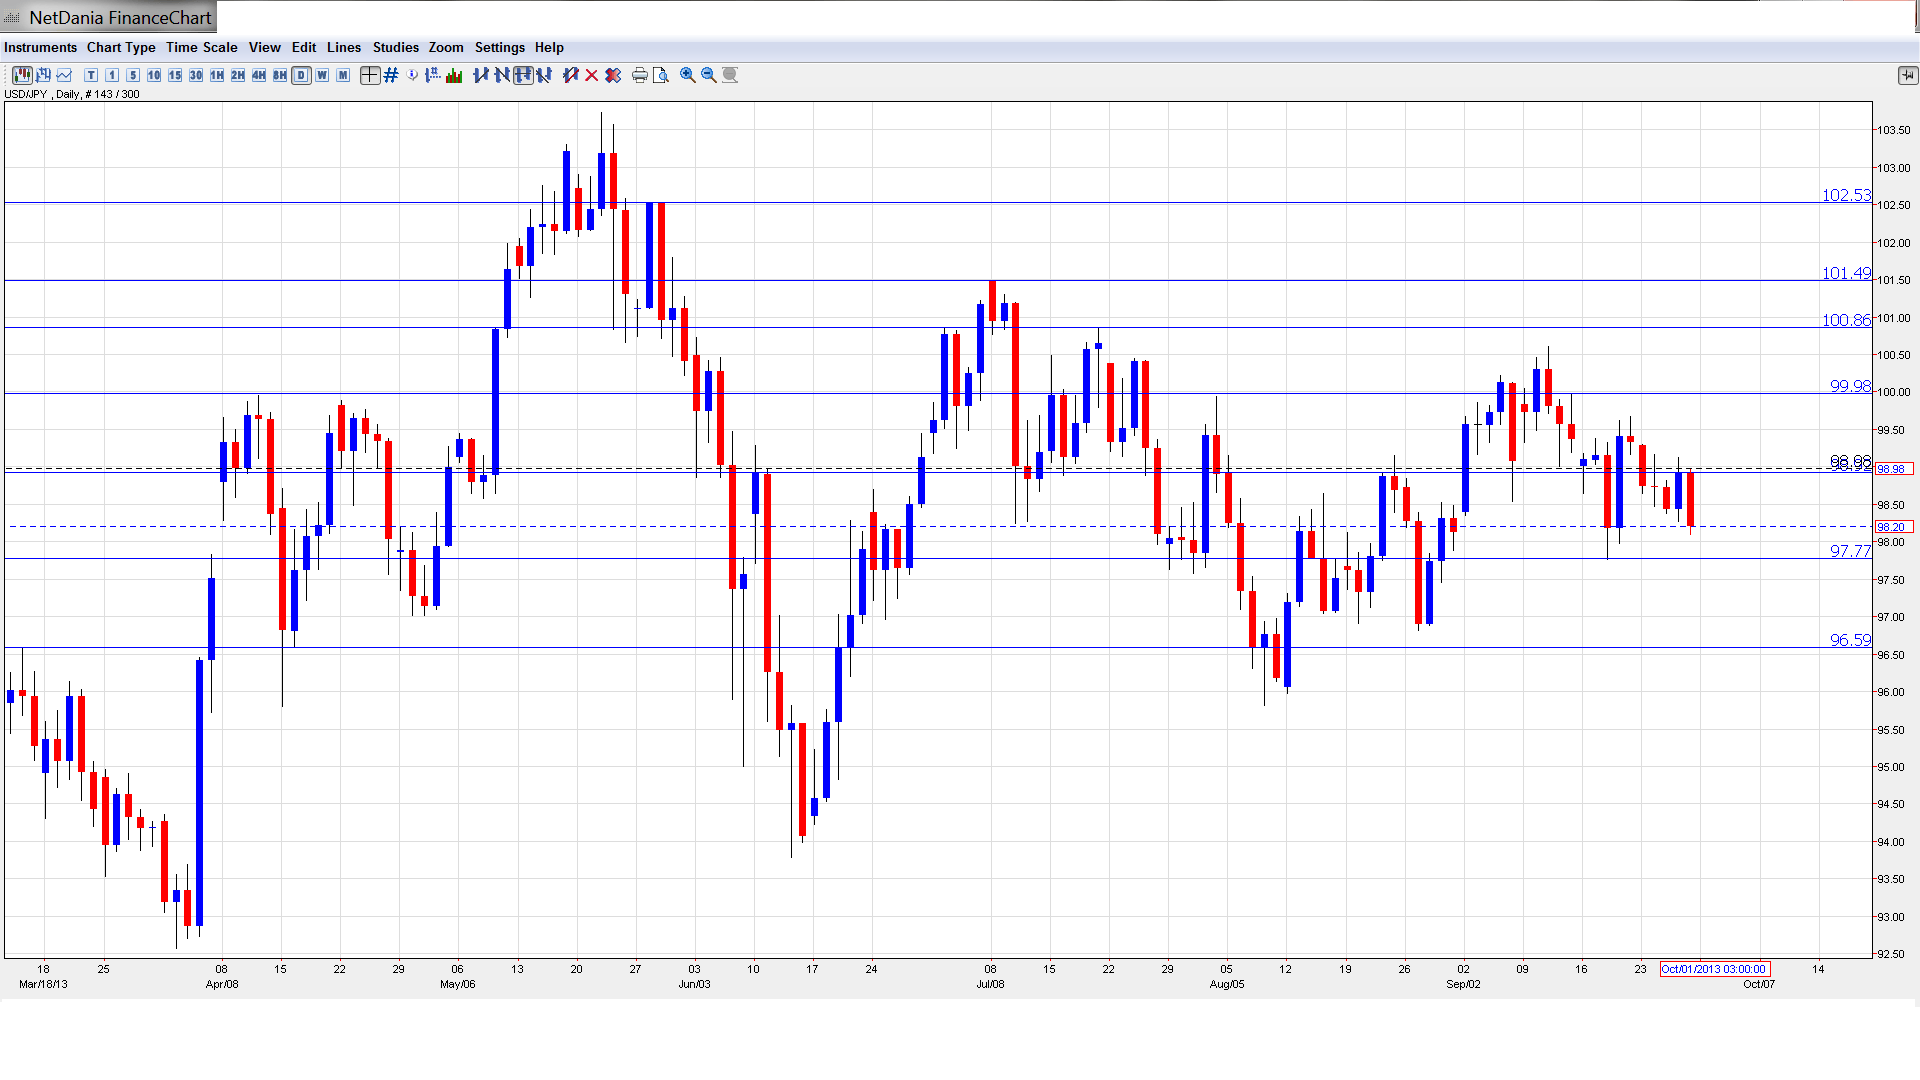
- Manufacturing PMI: Sunday, 23:15. Manufacturing PMI has been above the 50-point level since January, pointing to expansion in the manufacturing sector. The index came in at 52.2 points in July, and the markets are hoping for another strong showing in August.
- Preliminary Industrial Production: Sunday, 23:50. This indicator looks at total industrial output and provides an important gauge of the health of the manufacturing industry. The indicator bounced back from a sharp decline in June, posting a strong gain of 3.2% in July. However, this was well short of the estimate of 3.9%. The markets are bracing for a weak reading for August, with an estimate of -0.2%.
- Retail Sales: Sunday, 23:50. This important consumer spending indicator looked weak in the previous release, posting a decline of -0.3%. This missed the estimate of 0.0%. The markets are expecting a turnaround in the August reading, with an estimate of a healthy gain of 1.1%. Will the indicator follow suit and meet or beat this prediction?
- Housing Starts: Monday, 5:00. Housing Starts continues to point to double-digit growth. The indicator posted a gain of 12.0% in July, but this was lower than the previous month and well below the estimate of 14.5%. The estimate for the August reading stands at 12.9%.
- Household Spending: Monday, 23:30. Household spending is an important component of consumer spending, which is critical for economic growth. This indicator has not looked strong in recent readings, and posted a weak gain of 0.1% in July. The August estimate calls for more of the same, with a forecast of a 0.2% gain.
- Tankan Manufacturing Index: Monday, 23:50. The well-respected Tankan indexes are eagerly anticipated and can have a major impact on the movement of USD/JPY. The Manufacturing Index, released quarterly, rose to 4 points in Q2. This was the first reading above the zero level, which indicates improving conditions, in almost two years. The markets are expecting better news in Q3, with an estimate of 7 points.
- Tankan Non-Manufacturing Index: Monday, 23:50. This quarterly index shot up from 6 points to 8 points in Q2, its best showing since 2008. The upward trend is expected to continue, with an estimate for Q3 at 14 points.
- Average Cash Earnings: Tuesday, 1:30. Average Cash Earnings is an important gauge of consumer spending, since an increase in disposable income is likely to translate into more spending. The indicator improved to 0.4% last month, but this was well short of the estimate of 0.8%. The markets are bracing for a decline in the August reading, with an estimate of -0.2%.
- 10-year Bond Auction: Tuesday, 3:45. Average yields on Japanese bonds have been fairly steady, with the previous auction posting an average yield of 0.77%. No significant change is anticipated in the upcoming auction.
- Monetary Base: Tuesday, 23:50. Monetary Base continues to increase, in keeping with the BOJ’s monetary economic platform. In July, the indicator rose to 42.0%, and the estimate for the August release stands at 45.3%.
- BOJ Monetary Policy Statement: Friday, Tentative. One of this week’s highlights, the Policy Statement details the interest rate decision taken at the previous policy statement and factors that led up to the decision. The Statement will be carefully scrutinized by analysts for any clues regarding future interest rate moves. This will be followed by a BOJ press conference.
* All times are GMT
USD/JPY Technical Analysis
We begin with resistance at the round number of 104. This was a key line in May 2008. At that time, USD/JPY was in the midst of a rally which saw the pair climb as high as 110.
102.50 was an important resistance line in late May but has not been tested since that time.
101.44 was the post-crisis high seen in April 2009, and has not been tested since mid-July. 100.85 was busy in July as the dollar pushed above the 100 level. This line held intact as the pair pushed into 100-territory this week.
The significant 100 line saw some activity in September and continues to provide resistance. It has some breathing room as the pair trades at lower levels.
98.90 has reverted to a resistance role after being easily breached early this week. It could face pressure if the US dollar can reverse the current downward trend.
97.80 is next. This line was quite busy in July and August and is currently a weak support line. It could see action early in the week.
96.59 continues to provide strong support. This is followed by the round number of 95, a psychologically significant line. This line has held firm since mid-June.
93.79 marked the low point of a rally by USD/JPY which started in mid-June and saw the pair climb to the mid-101 range in July.
The final support level for now is 92.88, which last saw activity in April.
I am bullish on USD/JPY
Japanese indicators continue to point upwards, and if the Tankan indexes meet expectations, we could see the yen gain strength. Meanwhile, the US could face a government shutdown this week, as the Democrats and Republicans play political hardball, and how this event plays itself out could have a major impact on the currency markets.
Further reading:
- For a broad view of all the week’s major events worldwide, read the USD outlook.
- For EUR/USD, check out the Euro to Dollar forecast.
- For GBP/USD (cable), look into the British Pound forecast.
- For the Australian dollar (Aussie), check out the AUD to USD forecast.
- For USD/CAD (loonie), check out the Canadian dollar forecast.
