GBP/USD sustained sharp losses last week, losing close to 200 points. There are 10 events this week, highlighted by the PMI reports. Here is an outlook on the major events moving the pound and an updated technical analysis for GBP/USD.
In the US, Final GDP posted a slight decline, but housing numbers were strong, and the week ended with excellent consumer sentiment data. There were no significant releases out of the UK, but monetary divergence between the Fed and BOE is weighing on the pound.
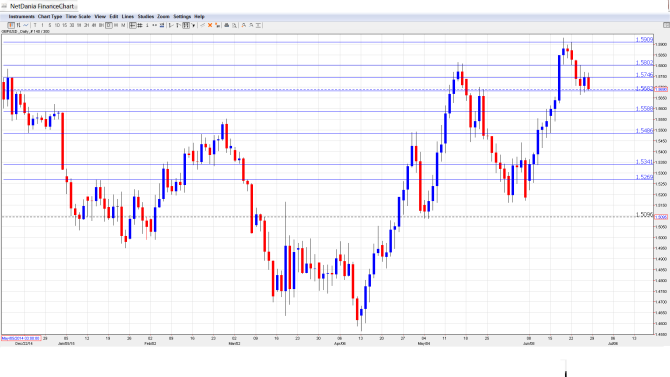
[do action=”autoupdate” tag=”GBPUSDUpdate”/]GBP/USD graph with support and resistance lines on it. Click to enlarge:
- Net Lending to Individuals: Monday, 8:30. Credit levels are closely linked to consumer spending, as more borrowing usually translates into stronger consumer spending. The indicator slipped to GBP 2.9 billion in April, but this easily beat the estimate of GBP 2.3 billion. The markets are expecting a strong improvement in the May report, with an estimate of GBP 3.3 billion.
- GfK Consumer Confidence: Monday, 23:05. The indicator dropped in May to 1 point after two straight readings of 4 points. This was short of the estimate of 4 points. Little change is expected in the June report, with a forecast of 2 points
- Current Account: Tuesday, 8:30. Current Account is closely linked to currency demand, as foreigners need to buy British pounds in order to buy British goods and services. The UK continues to post current account deficits, and the Q1 deficit of GBP 25.3 billion was substantially higher than the estimate of a deficit of GBP 21.2 billion. The estimate for the Q2 deficit stands at GBP 23.7 billion.
- Final GDP: Tuesday, 8:30. Final GDP is closely monitored by the markets and an unexpected reading can have a significant impact on the movement of GBP/USD. The indicator posted a gain of 0.6% in Q1, within expectations. The markets are braced for a softer reading in the Q2 report, with an estimate of 0.4%.
- Manufacturing PMI: Wednesday, 8:30. The PMI parade kicks off with Manufacturing PMI, the first of three PMIs this week. This indicator showed little change in the April release, with a reading of 52.0- points, short of the estimate of 52.7 points. The forecast for the May reading stands at 52.6 points.
- BOE Financial Stability Report: Wednesday, 9:30. This report is released twice a year, and could affect the pound if there are unexpected items in the report.
- Nationwide HPI: Thursday, 6:00. Housing inflation indicators provide a snapshot of the level of activity in the housing sector. The index slipped to 0.3% in May, within expectations. The markets are expecting better news in the June report, with an estimate of 0.6%.
- Halifax HPI: Thursday, 2nd-7th. The indicator declined by 0.1% in May, compared to a gain of 1.6% a month earlier. The estimate stood at +0.2%. Will the index push back into positive territory in the upcoming release?
- Construction PMI: Thursday, 8:30. The index posted a strong gain in the May reading, improving to 55.9 points. This beat the estimate of 55.1 points. The upward swing is expected to continue, with an estimate of 5.6.6 points.
- Services PMI: Friday, 8:30. The week winds up with Services PMI, which continues to point to expansion in the services sector. In May, the index slipped to 56.5 points, a 5-month low and well short of the forecast of 59.2 points. The markets are anticipating better news in the June report, with an estimate of 57.4 points.
* All times are GMT
GBP/USD Technical Analysis
GBP/USD opened the week at 1.5870, and quickly reached resistance at 1.5909 (discussed last week). The pair then reversed directions, dropping to a low of 1.5664. GBP/USD closed the week at 1.5690.
Live chart of GBP/USD: [do action=”tradingviews” pair=”GBPUSD” interval=”60″/]
Technical lines from top to bottom
1.6287 was a cap in September.
1.6131 is an important resistance line which has held since late October.
1.6006 is next, just above the symbolic 1.60 level.
1.5909 has held firm as resistance since November 2013, and was tested for a second straight week. It is protecting the symbolic 1.60 level.
1.5746 has switched to a resistance role following the pair’s sharp losses.
1.5682 was an important cap in December 2014 and January 2015. It is a weak support line.
1.5590 worked as support late in 2014 and was tested earlier in the month.
1.5485 was breached as the pound posted a sharp rally earlier in June.
1.5341 is the next line of support.
1.5269 was an important support level in March. It is the final support level for now.
I am bearish on GBP/USD.
After a strong rally for most of June, the pound posted sharp losses last week. The FOMC may be slightly more hawkish than perceived, as a Fed policymaker spoke of one or even two rate hikes in 2015. If there are further hints about a rate hike, the greenback could jump higher. As well, the escalating crisis over Greece crisis is weighing on the pound, as the UK has close economic and political ties with the continent.
In our latest podcast, we discuss building on the US recovery, the Greek crisis and EUR, Saudi solar and next week’s events.
Follow us on Stitcher.
Further reading:
- For a broad view of all the week’s major events worldwide, read the USD outlook.
- For EUR/USD, check out the Euro to Dollar forecast.
- For the Japanese yen, read the USD/JPY forecast.
- For the kiwi, see the NZD/USD forecast.
- For the Australian dollar (Aussie), check out the AUD to USD forecast.
- For the Canadian dollar (loonie), check out the USD to CAD forecast.
