AUD/USD posted modest gains last week, closing at 0.7276. This week’s key event is Retail Sales. Here is an outlook on the major market-movers and an updated technical analysis for AUD/USD.
In the US, it was a busy start to the New Year. The ISM Manufacturing PMI improved and beat expectations. Employment numbers were a mix, as wages edged higher but NFP payrolls fell considerably. The Fed meeting minutes were cautious, as policymakers wait to see how the economy will respond to Donald Trump’s economic policies. Australia surprised the markets with a trade surplus, the first since March 2014.
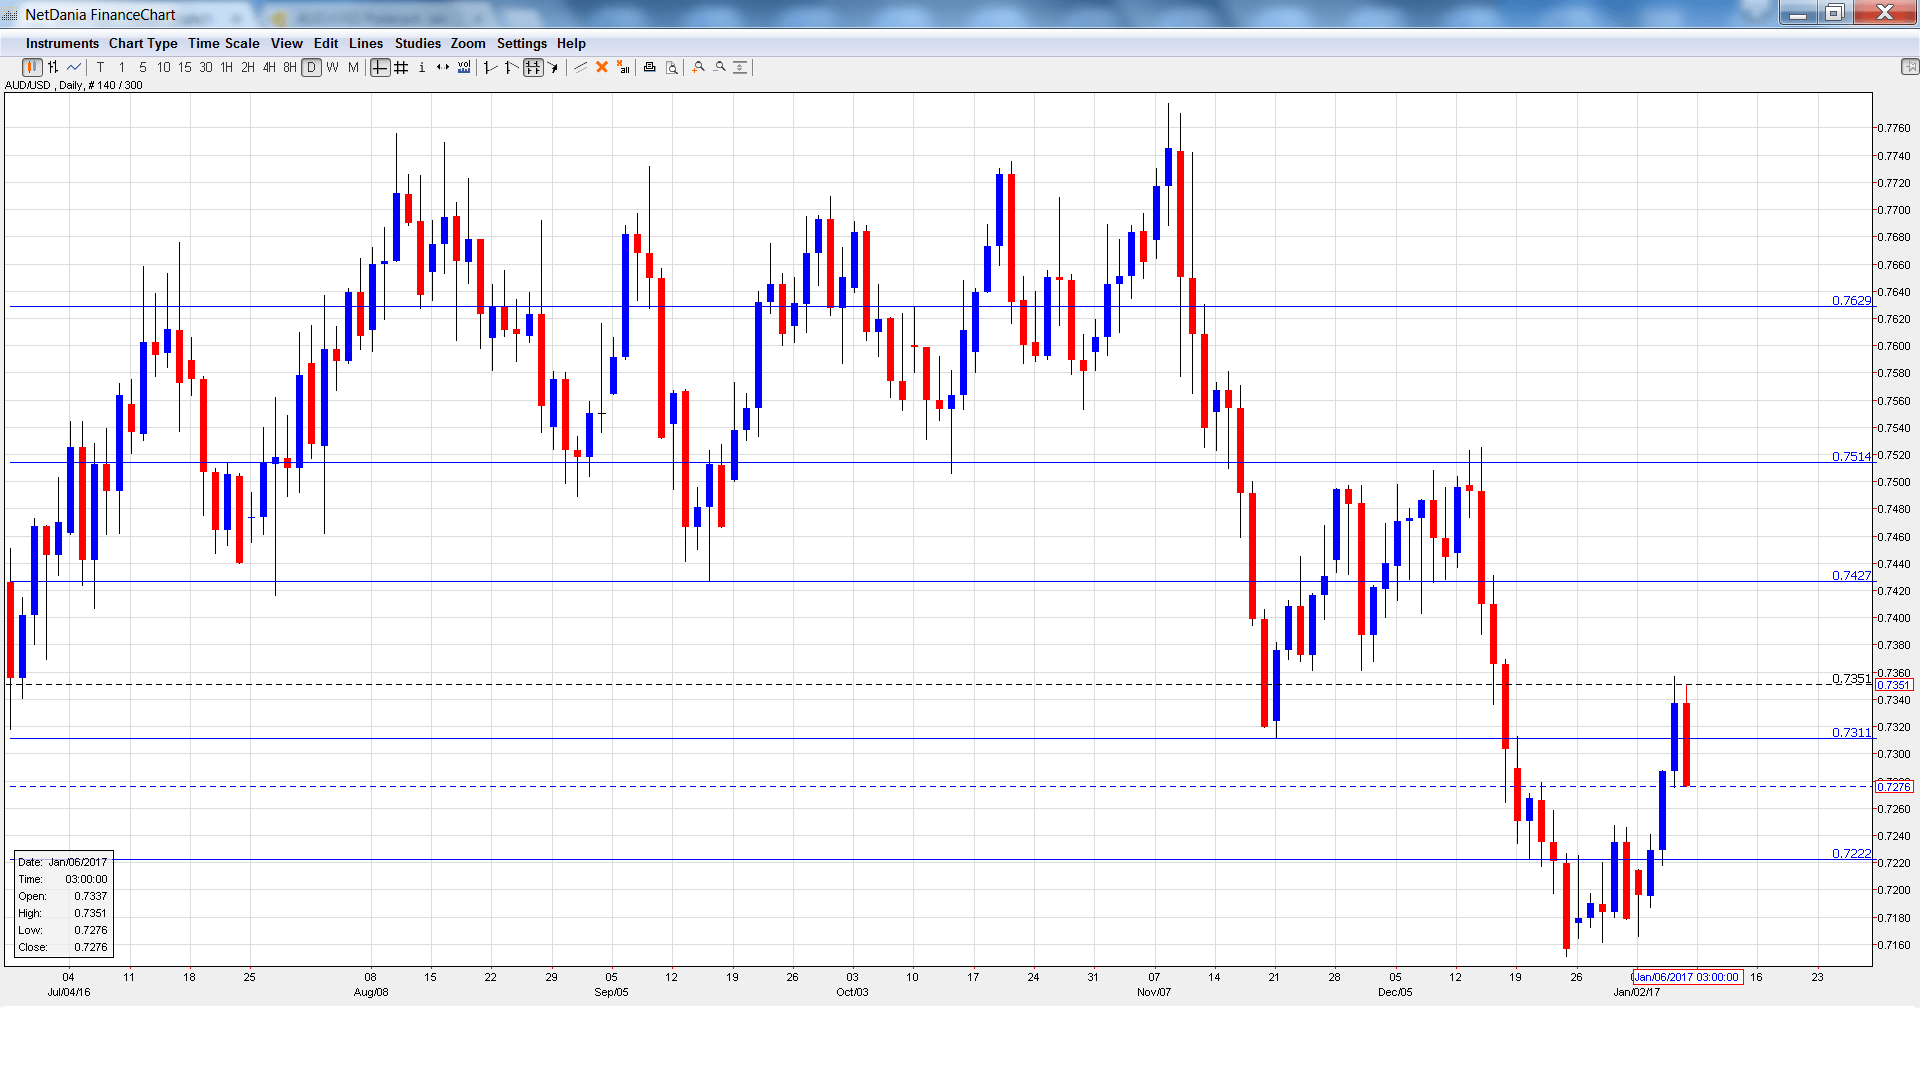
[do action=”autoupdate” tag=”AUDUSDUpdate”/]AUD/USD daily graph with support and resistance lines on it. Click to enlarge:
- AIG Construction Index: Sunday, 22:30. The construction indicator has posted two straight readings below the 50-point level, pointing to decline in the construction sector. Will we see an improvement in the December release?
- Building Approvals: Monday, 00:30. Building Approvals tends to show sharp fluctuations, making accurate forecasts a tricky task. In October, the indicator plunged 12.6%, well of the forecast of 2.2% gain. The November estimate stands at 4.6%.
- Retail Sales: Tuesday, 00:30. Retail Sales is the key event of the week. In October, the indicator edged lower to 0.5%, beating the forecast of 0.3%. The downward trend is expected to continue in November, with an estimate of 0.4%.
- Chinese CPI: Tuesday, 1:30. Key Chinese indicators can have a considerable impact on the Australian dollar, so Chinese events should be treated as market-movers. The indicator improved to 2.3% in November, edging above the forecast of 2.2%. The estimate for December remains at 2.2%.
- Chinese Trade Balance: Friday, Tentative. China’s trade surplus dropped to $298 million in November, short of the forecast of $307 million. The markets are expecting a strong rebound in the December report, with an estimate of $345 billion.
AUD/USD Technical Analysis
AUD/USD opened the week at 0.7214 and quickly touched a low of 0.7166, as support held firm at 0.7148 (discussed last week). The pair then reversed directions and climbed to a high of 0.7357, testing resistance at 0.7223 . AUD/USD closed the week at 0.7276.
Live chart of AUD/USD:
Technical lines from top to bottom:
We start with resistance at 0.7630.
0.7513 was a cushion in April 2015.
0.7427 is next.
0.7311 marked a low point in November.
0.7223 is next.
0.7148 held firm as AUD/USD lost ground early in the week before rebounding.
0.7015 is protecting the symbolic 0.70 level.
0.6918 was last tested in late January.
0.6827 is the final support line for now.
I am bearish on AUD/USD
The US economy enters 2017 in excellent shape, and monetary and fiscal divergence is bullish for the greenback ahead of the Trump inauguration.
Our latest podcast is titled Is the FED Data or Donald Dependent?
Follow us on Sticher or iTunes
Safe trading!
Further reading:
- For a broad view of all the week’s major events worldwide, read the USD outlook.
- For EUR/USD, check out the Euro to Dollar forecast.
- For the Japanese yen, read the USD/JPY forecast.
- For GBP/USD (cable), look into the British Pound forecast.
- For the Canadian dollar (loonie), check out the Canadian dollar forecast.
- For the kiwi, see the NZD/USD forecast.
