AUD/USD ended the year quietly, as the pair was unchanged last week, closing at 0.7178. There are six events this week. Here is an outlook on the major market-movers and an updated technical analysis for AUD/USD.
The week between Christmas and New Year’s was marked by thin volumes and the AUD/USD ended the week unchanged. In the US, consumer confidence jumped and unemployment claims dropped, beating expectations. There were no major Australian events last week. China’s strong data supports the Aussie.
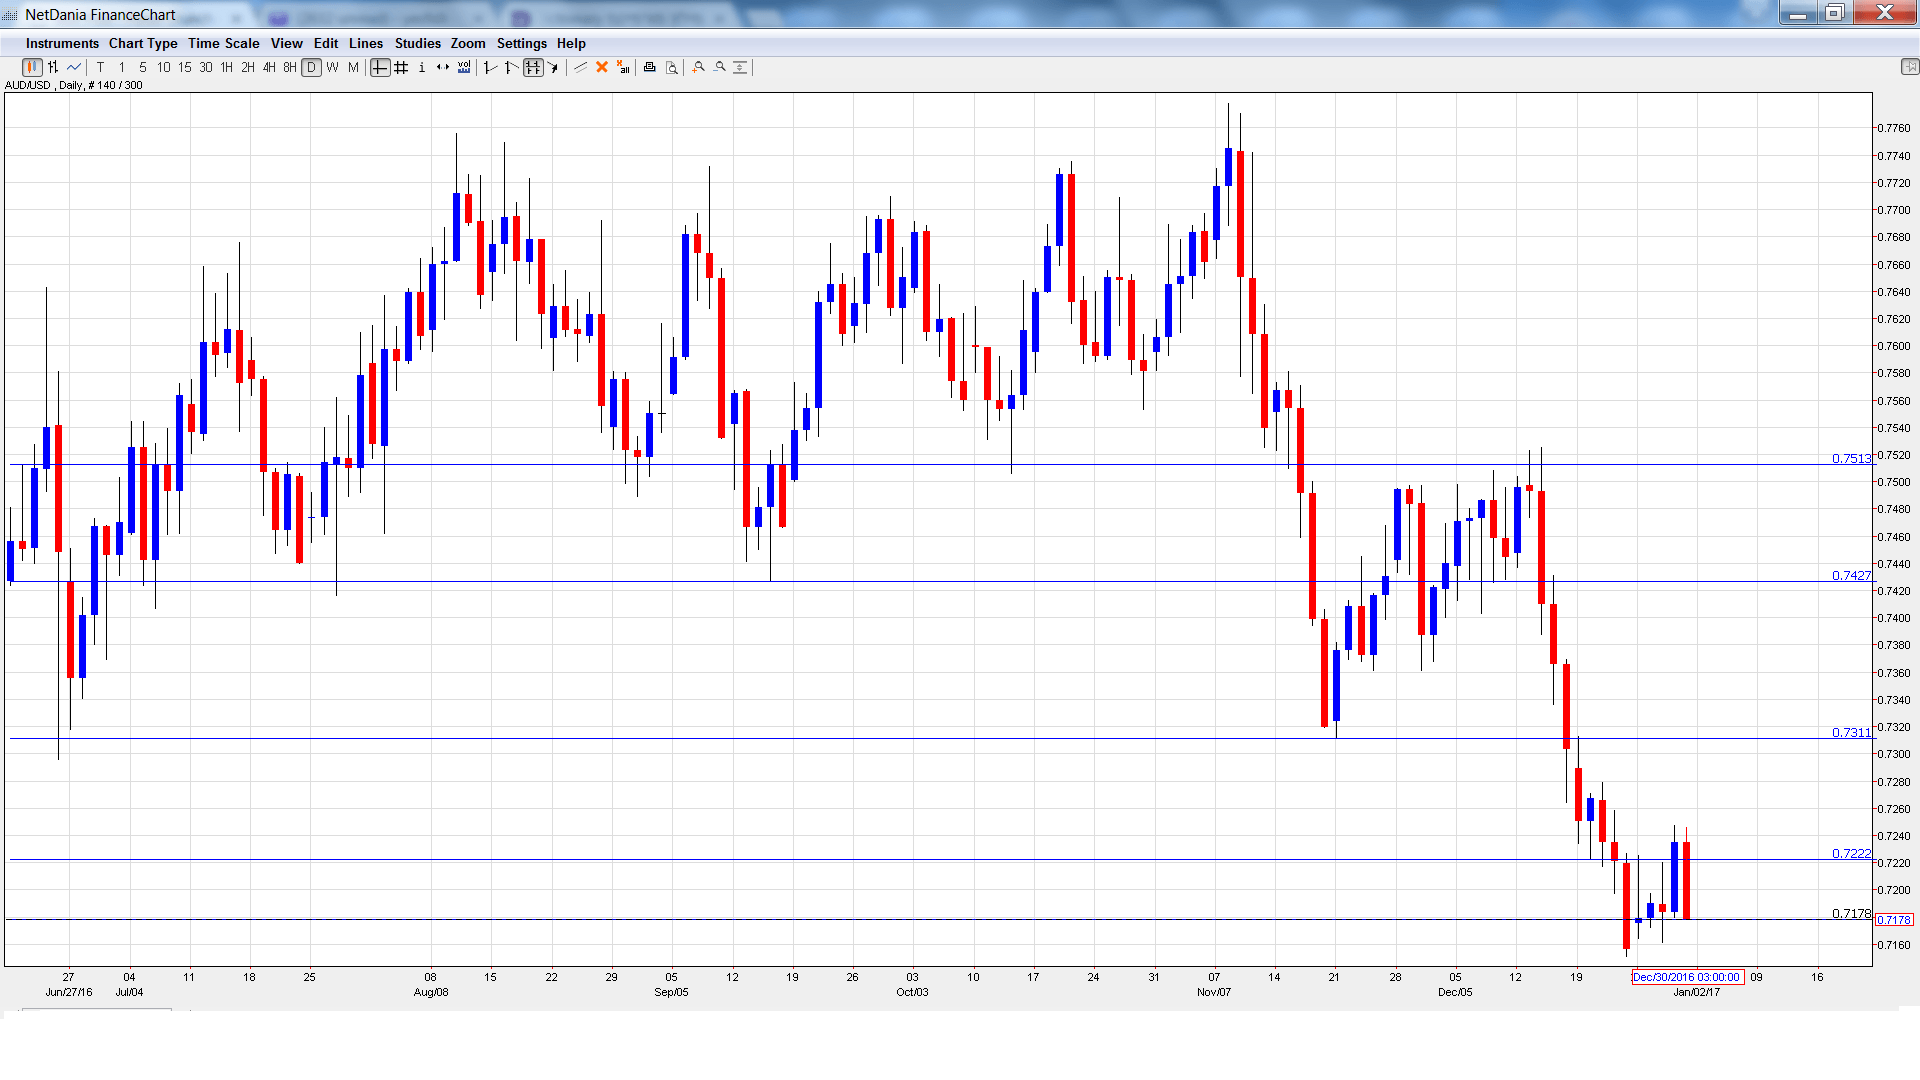
[do action=”autoupdate” tag=”AUDUSDUpdate”/]AUD/USD daily graph with support and resistance lines on it. Click to enlarge:
- Chinese Manufacturing PMI: Sunday, 1:00. The Australian dollar is sensitive to key Chinese indicators, as the Asian giant is Australia’s number one trading partner. The indicator is expected to remain almost unchanged in December, at 51.6 points.
- AIG Manufacturing Index: Monday, 22:30. This indicator continues to move upwards and climbed to 54.2 in November, its strongest reading since June. Will the upward trend continue in the December report?
- Chinese Caixin Manufacturing PMI: Tuesday, 1:45. The PMI dipped to 50.9 in November, matching the forecast. The indicator is expected to remain at this level in December.
- Commodity Prices: Tuesday, 5:30. Commodity Prices continue to move higher, as the November reading surged by 32.1%. Will the upward trend continue in December?
- AIG Services Index: Wednesday, 22:30. The index edged up to 51.1 points in November, pointing to a stagnant services sector. The markets will be hoping for a stronger reading in December.
- Trade Balance: Friday, 00:30. Australia’s trade deficit widened to A$1.54 billion in October, much higher than the estimate of a deficit of A$0.72 billion. Better news is expected in the November release, with the deficit projected to drop to A$0.55 billion.
AUD/USD Technical Analysis
AUD/USD opened the week at 0.7175 and touched a low of 0.7161. The pair then reversed directions and climbed to a high of 0.7247, testing resistance at 0.7223 (discussed last week). AUD/USD was unable to consolidate at this level and closed the week at 0.7178.
Live chart of AUD/USD:
Technical lines from top to bottom:
0.7513 was a cushion in April 2015.
0.7427 is next.
0.7311 marked a low point in November.
0.7223 was tested as the pair pushed higher late in the week before retracting.
0.7148 is a weak support line.
0.7015 is protecting the symbolic 0.70 level.
0.6918 was last tested in late January.
0.6827 is the final support line for now.
I am bearish on AUD/USD
Welcome to a brand new year! With the Trump presidency around the corner, the markets are expecting US growth to continue, which could mean more rate hikes from the Federal Reserve. So, the US dollar could start 2017 with broad gains.
Our latest podcast is titled What will move markets in 2017
Follow us on Sticher or iTunes
Safe trading!
Further reading:
- For a broad view of all the week’s major events worldwide, read the USD outlook.
- For EUR/USD, check out the Euro to Dollar forecast.
- For the Japanese yen, read the USD/JPY forecast.
- For GBP/USD (cable), look into the British Pound forecast.
- For the Canadian dollar (loonie), check out the Canadian dollar forecast.
- For the kiwi, see the NZD/USD forecast.
