GBP/USD posted considerable losses during the week but recovered. The pair closed at 1.2542. This week’s key events are the PMIs and Manufacturing Production. Here is an outlook for the highlights of this week and an updated technical analysis for GBP/USD.
In the US, CB Consumer Confidence improved sharply in March. Over in the UK, British Current Account improved sharply and beat expectations. Final GDP edged up to 0.7%, matching the forecast.
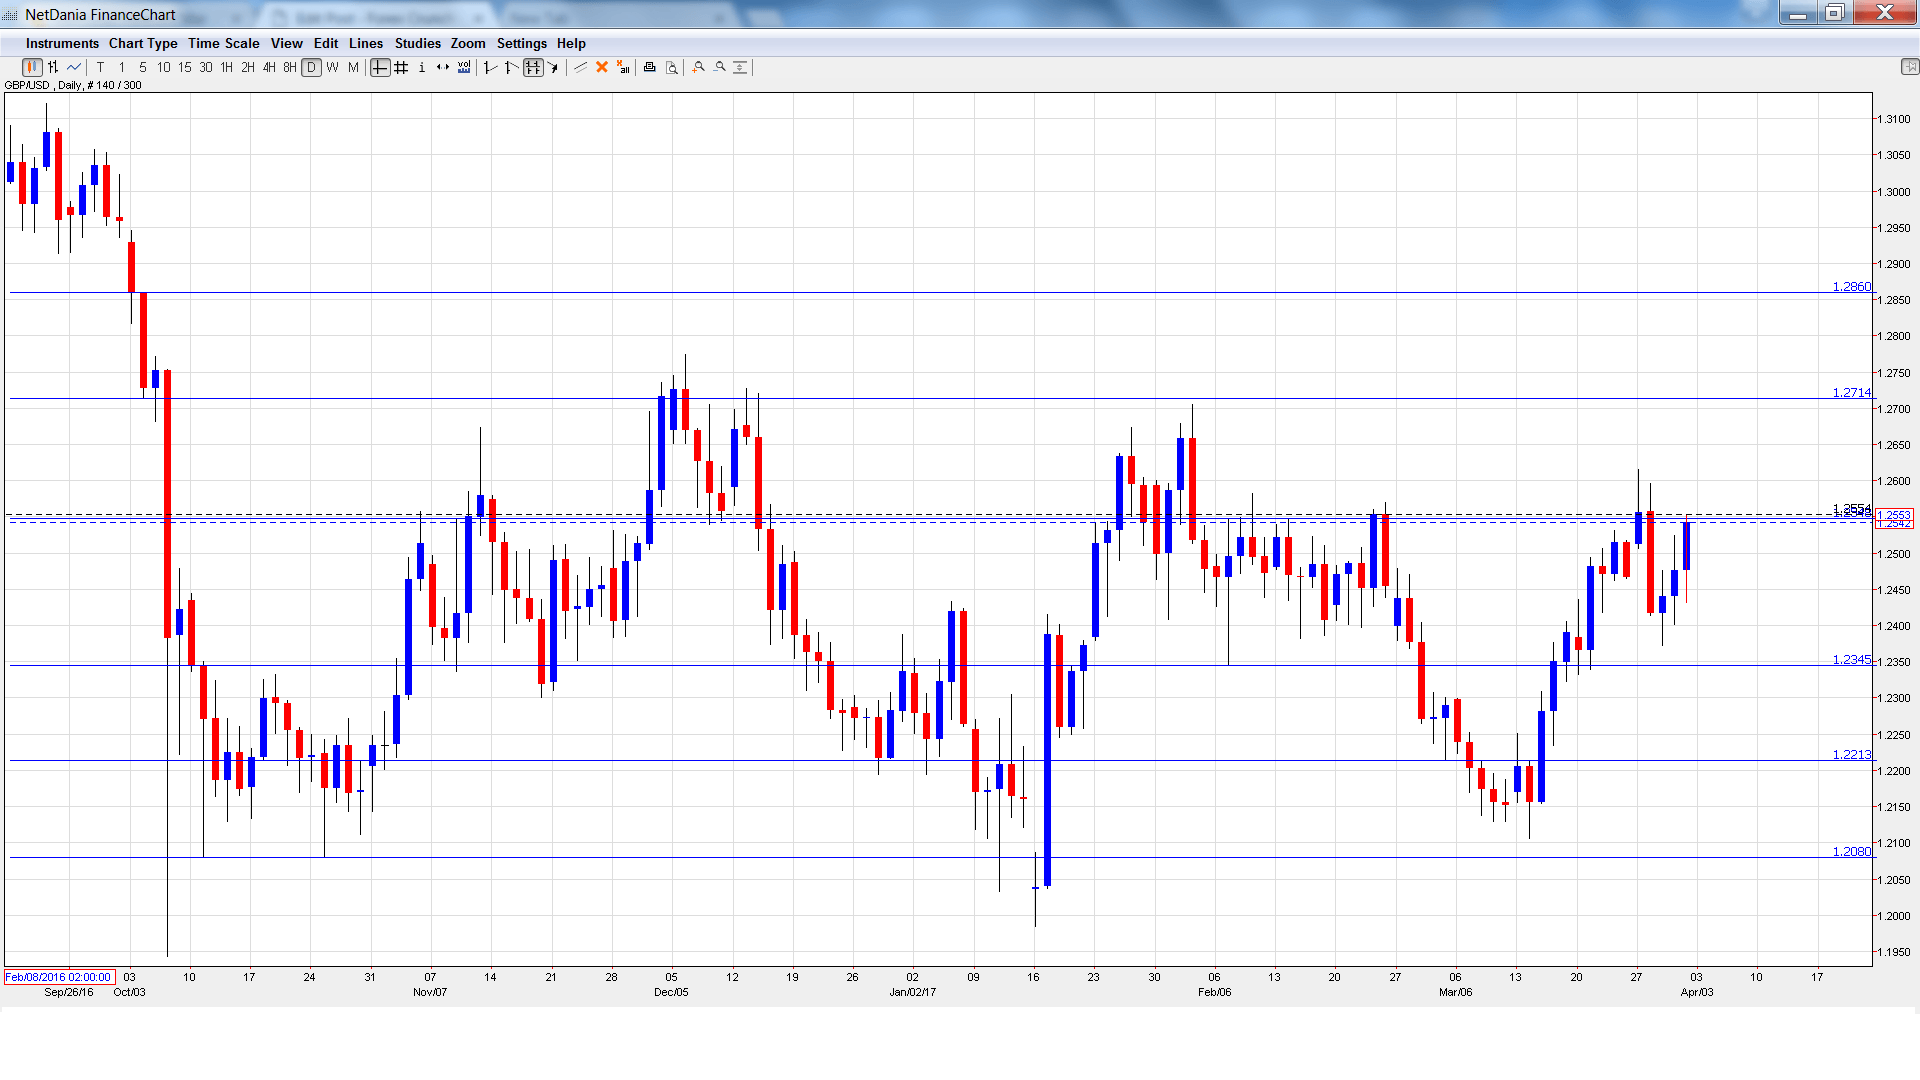
[do action=”autoupdate” tag=”GBPUSDUpdate”/]GBP/USD graph with support and resistance lines on it. Click to enlarge:
- Manufacturing PMI: Monday, 8:30: The indicator dipped to 54.6 in February, shy of the forecast of 55.7 points. The indicator is expected to rebound in March, with an estimate of 55.1 points.
- Construction PMI: Tuesday, 8:30. The PMI edged up to 52.5 in February, pointing to slight expansion. Another reading of 52.5 is expected in the March report.
- 10-y Bond Auction: Tuesday, Tentative. The 10-year bond improved to 1.31% in March, up from 1.18% a month earlier.
- BRC Shop Price Index: Tuesday, 23:01. This indicator measures consumer inflation in BRC shops. In March, the indicator declined 1.0%, a stronger reading than a month earlier.
- Services PMI: Wednesday, 8:30. Services PMI dipped to 53.5 in February, short of the forecast of 54.2 points. Little change is expected in March, with an estimate of 53.5 points.
- Housing Equity Withdrawal: Thursday, 8:30. This indicator is released quarterly. The indicator improved to -10.9 billion pounds in Q3, below the forecast of -11.1 billion. The estimate for Q4 stands at -9.5 billion.
- Halifax HPI: Friday, 7:30. This index provides a snapshot of the level of activity in the housing sector. The index rebounded in February, with an estimate of 0.1%, shy of the forecast of 0.4%. The estimate for March stands at 0.2%.
- Manufacturing Production: Friday, 8:30. This key event should be treated as a market-mover. The indicator declined 0.9% in January, weaker than the estimate of -0.6%. The markets are expecting a rebound in February, with an estimate of 0.3%.
- Goods Trade Balance: Wednesday, 8:30. The UK’s trade deficit narrowed to GBP 10.8 billion in January, better than the estimate of GBP 11.1 billion. The estimate for February stands at GBP 10.9 billion.
- NIESR GDP Estimate: Friday, 12:00. This monthly indicator helps analysts predict GDP, which is released on a quarterly basis. In February, the indicator edged lower to 0.6%. Will we see a stronger reading in the March report?
*All times are GMT
GBP/USD Technical Analysis
GBP/USD opened the week at 1.2512 and quickly climbed to a high of 1.2616. The pair then reversed directions and dropped to a low of 1.2373, as support held at 1.2345 (discussed last week). GBP/USD closed the week at 1.2542.
Live chart of GBP/USD:
We start with resistance at 1.2860.
1.2775 has held since December 2016.
1.2548 is next.
1.2345 was a low point in February.
1.2213 is protecting the 1.22 level.
1.2080 is the final support level for now.
I am bearish on GBP/USD.
The US economy continues to fire on all cylinders, and the Fed is expected to hike rates two more times in 2017. The UK has weathered Brexit fairly well, but bad blood between the UK and the EU could derail negotiations over Brexit and hurt the pound.
Our latest podcast is titled Brexit Bad and “Clean Coal”
Follow us on Sticher or iTunes
Safe trading!
Further reading:
- For a broad view of all the week’s major events worldwide, read the USD outlook.
- For EUR/USD, check out the Euro to Dollar forecast.
- For the Japanese yen, read the USD/JPY forecast.
- For the kiwi, see the NZD/USD forecast.
- For the Australian dollar (Aussie), check out the AUD to USD forecast.
- For the Canadian dollar (loonie), check out the USD to CAD forecast.
