AUD/USD was unchanged last week, as the pair closed at 0.7444. This week’s key event is Unemployment Change. Here is an outlook on the major market-movers and an updated technical analysis for AUD/USD.
It was a good week in the US, as key economic indicators continue to impress. ISM Non-Manufacturing PMI beat expectations and UoM Consumer Sentiment jumped and easily beating the estimate. As expected the RBA maintained rates at 1.50%. Australian GDP was weak in Q3, posting a decline of 0.5%. This marked the first decline since 2011.
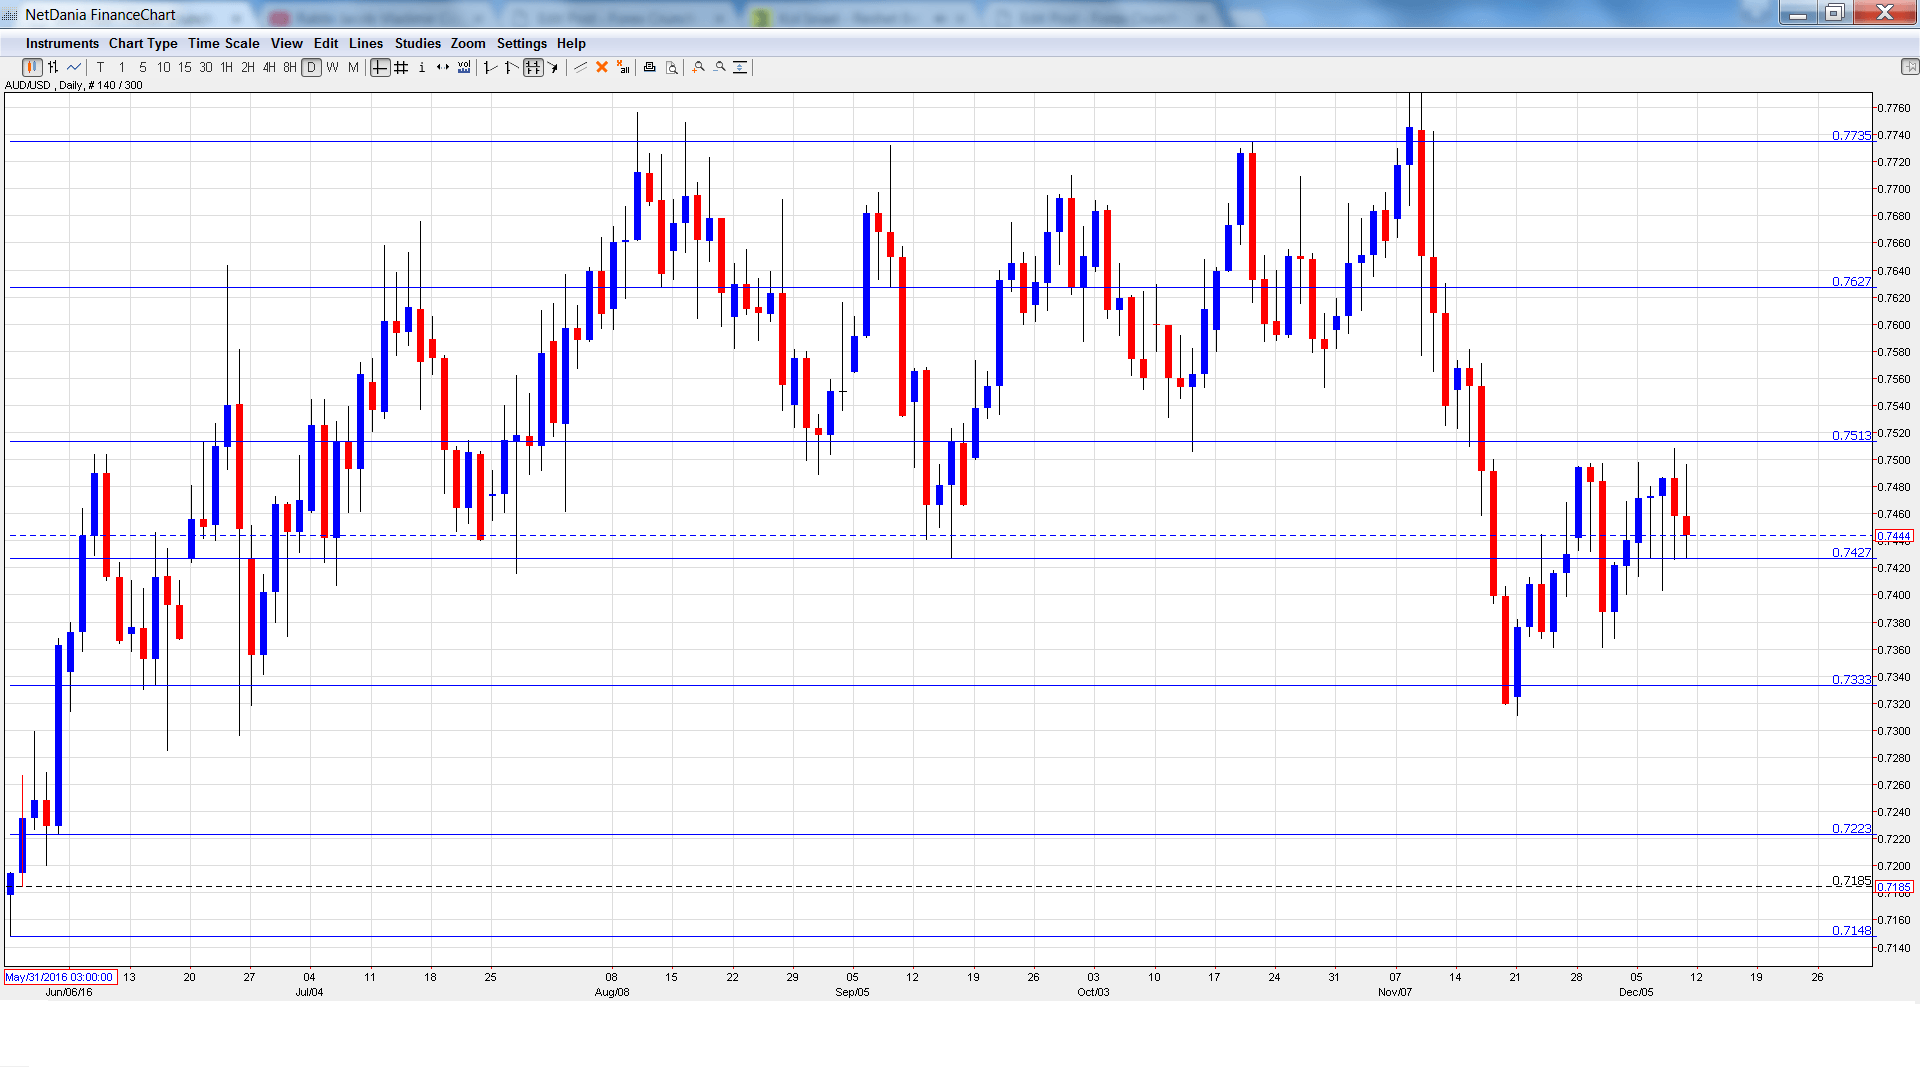
[do action=”autoupdate” tag=”AUDUSDUpdate”/]AUD/USD daily graph with support and resistance lines on it. Click to enlarge:
- HPI: Tuesday, 00:30. This indicator provides a snapshot of the level of activity in the Australian housing sector. The index rebounded with a gain of 2.0% in Q3, but this fell short of the forecast of 3.1%. The estimate for the Q4 reading stands at 2.6%.
- Chinese Industrial Production: Tuesday, 2:00. The indicator has been steady, posting two straight readings of 6.1%. An identical reading is expected in the November report.
- Westpac Consumer Sentiment: Tuesday, 23:30. This minor consumer confidence indicator declined 1.1% in November, its weakest reading in four months. Will we see a rebound into positive territory in December?
- New Motor Vehicle Sales: Wednesday, 00:30. The important consumer spending indicator declined 2.4% in October, its sharpest decline since April. The markets will be hoping for better news in the November report.
- MI Inflation Expectations: Thursday, 00:00. This indicator helps analysts predict actual inflation figures. The index slipped to 3.2% in October, down from 3.7% a month earlier.
- Employment Change: Thursday, 00:30. This is one of the most important indicators and should be treated as a market-mover. In October, the indicator rebounded to 9.8 thousand, but this was well short of 20.3 thousand. The markets are expecting a strong improvement in November, with an estimate of 17.6 thousand. The unemployment rate has hovered at 5.6% in the past three months and is expected
- RBA Bulletin: Thursday, 00:30. This minor indicator contains an analysis of economic conditions and could shed some light on the bank’s future monetary policy.
AUD/USD Technical Analysis
AUD/USD opened the week at 0.7438 and dropped to a low of 0.7403, testing support at 0.7408 (discussed last week). The pair then reversed directions and climbed to 0.7508. AUD/USD closed the week at 0.7444.
Live chart of AUD/USD:
Technical lines from top to bottom:
With AUD/USD posting sharp losses, we begin at lower levels:
We start with resistance at 0.7849.
0.7737 was a cap in June 2015.
0.7626 is next.
0.7513 is an immediate resistance line. It was a cushion in April 2015.
0.7427 is a weak support level. It marked the low point for the month of September.
0.7333 was a cap in December 2015.
0.7223 has held firm in support since June.
0.7148 is next.
0.7015 is protecting the symbolic 0.70 level. It is the final support line for now.
I remain bearish on AUD/USD
An unexpected decline in Australian GDP could set the stage for a rate cut in early 2017. Over in the US, the Fed will likely raise rates this year for the first time since December, so the greenback could get a boost.
Our latest podcast is titled From the Crude Cut to Draghi’s Drag
Follow us on Sticher or iTunes
Further reading:
- For a broad view of all the week’s major events worldwide, read the USD outlook.
- For EUR/USD, check out the Euro to Dollar forecast.
- For the Japanese yen, read the USD/JPY forecast.
- For GBP/USD (cable), look into the British Pound forecast.
- For the Canadian dollar (loonie), check out the Canadian dollar forecast.
- For the kiwi, see the NZD/USD forecast.
