AUD/USD continues to improve, and gained 80 points last week. The pair closed the week at 0.7080. It’s a busy week, with 13 events on the schedule. Here is an outlook on the major market-movers and an updated technical analysis for AUD/USD.
The Australian dollar took advantage of a dovish Fed statement, as the Fed opted not to raise rates. US numbers did not impress last week, as durables were short of expectations. The Aussie also received a boost from Australian inflation numbers, as CPI beat the estimate.
[do action=”autoupdate” tag=”AUDUSDUpdate”/]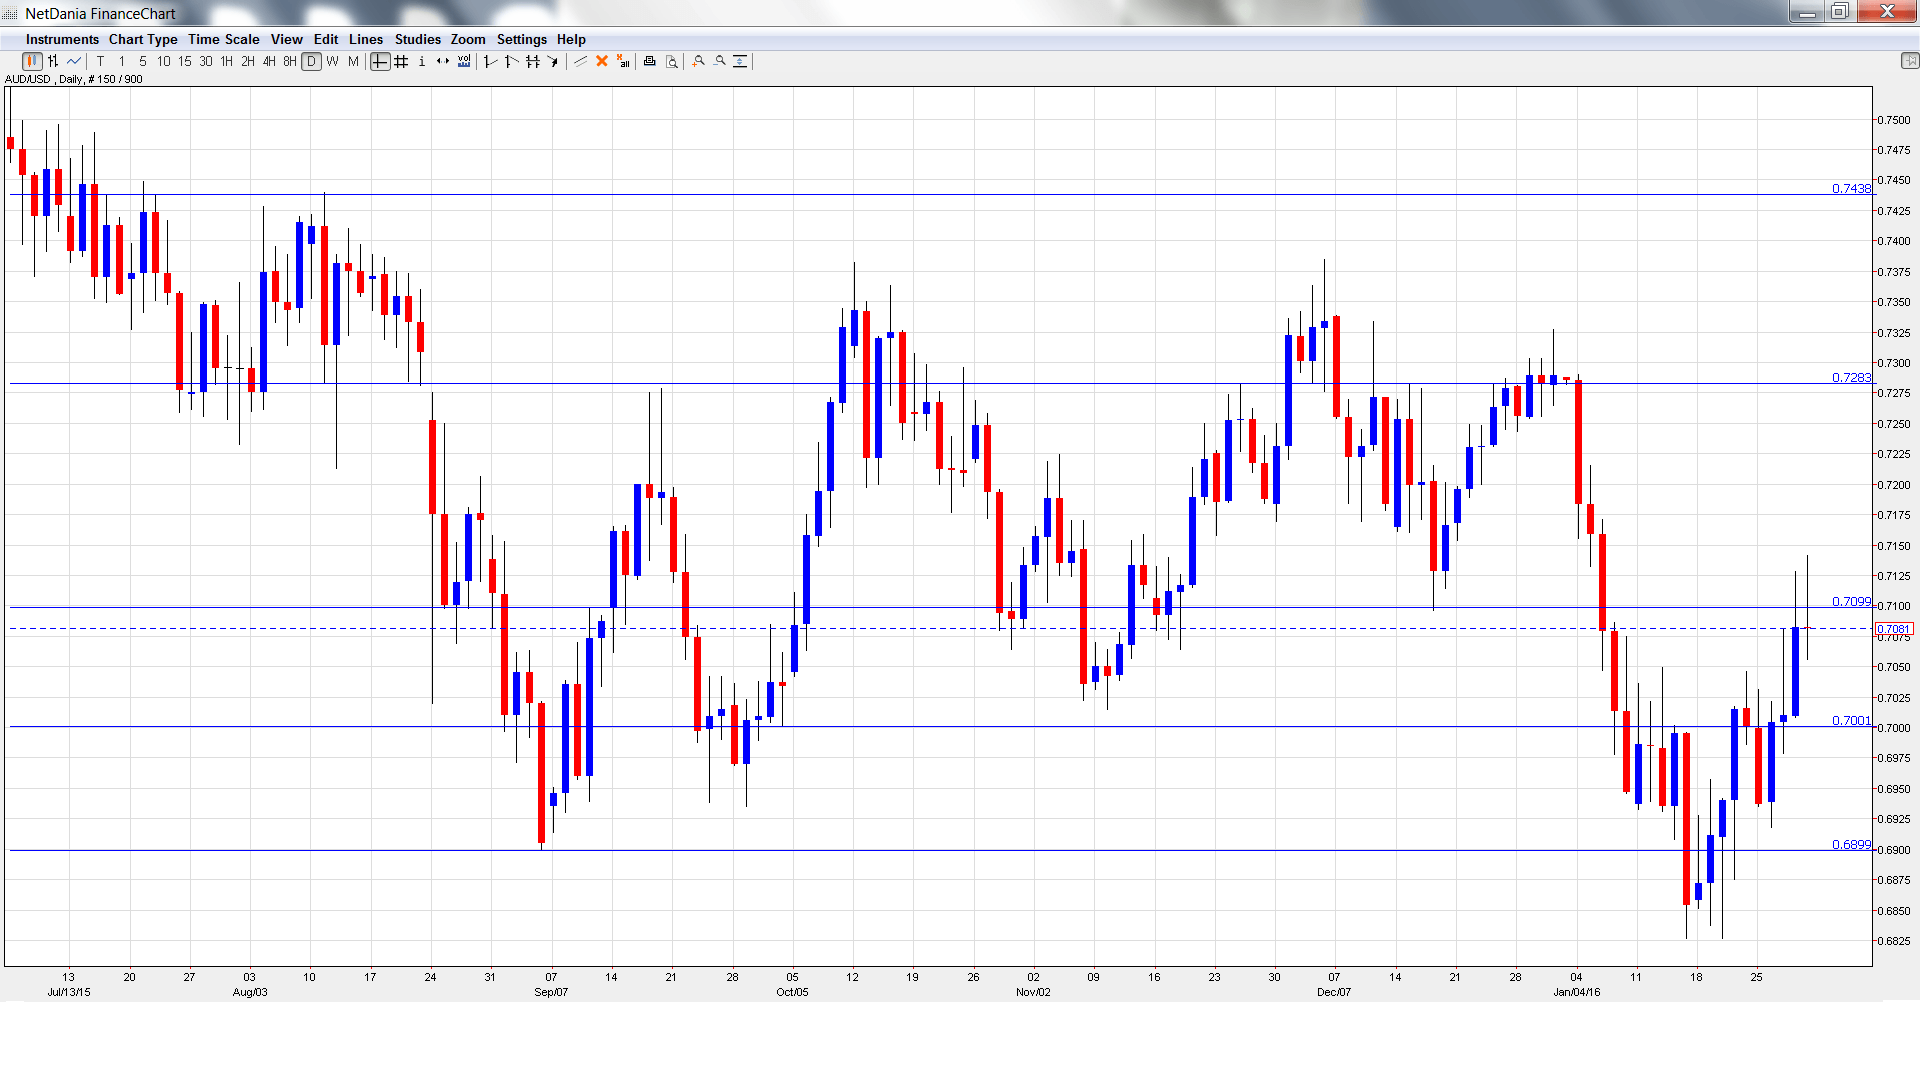
- AIG Manufacturing Index: Sunday, 22:30. This minor event continues to hover slightly above the 50-point level, indicative of slight expansion in the manufacturing sector. The December reading dipped to 51.9 points, down from 52.5 points a month earlier.
- MI Inflation Gauge: Sunday, 23:30. This index has posted small gains, and edged up to 0.2% in December. Analysts use this monthly indicator to track and predict CPI, which is released every quarter.
- Chinese Manufacturing PMI: Monday, 1:00. Key Chinese events such as Manufacturing PMI can have a significant impact on the Australian dollar. The index has posted 5 consecutive readings below the 50-point level, pointing to slight contraction in the manufacturing sector. Little change is expected in the January report, with an estimate of 49.6 points.
- Chinese Caixin Manufacturing PMI: Monday, 1:45. This PMI is pointing to contraction in the manufacturing sector. The December report came in at 48.2 points, short of the estimate of 48.9 points. The forecast for January stands at 48.1 points.
- Commodity Prices: Monday, 5:30. Commodity Prices continue to slip, as the December reading came in at -23.3%, and the January release will likely be another steep decline.
- Cash Rate: Tuesday, 3:30. The RBA is expected to maintain the benchmark rate at 2.00%, where it has been pegged since May. The RBA will issue its decision through a rate statement.
- AIG Services Index: Tuesday, 22:30. The index has been slipping in recent months, and has posted three straight readings below the 50-level, which separates contraction from expansion. The indicator softened in December, dropping to 46.3 points.
- Building Approvals: Wednesday, 00:30. Building Approvals tends to show strong volatility, which often results in readings which are well off the forecasts. In December, the indicator plunged 12.7%, much worse than the estimate of -2.8%. The markets are expecting a strong turnaround in the January release, with the estimate standing at 4.8%.
- Trade Balance: Wednesday, 00:30. Australia’s trade deficit narrowed to A$2.91 billion in November, better than the forecast of a deficit of A$2.98 billion. The positive trend is expected to continue in December, with an estimate of A$2.45 billion.
- NAB Quarterly Business Confidence: Thursday, 00:30. The indicator reversed directions in Q3, dropping to 0 points. Will we see a move into positive territory in Q4?
- AIG Construction Index: Thursday, 22:30. The index came in at 46.8 points in December, the first time that it has slipped below the key 50-level in 5 months. The estimate for January stands at 46.8 points.
- RBA Monetary Policy Statement: Friday, 00:30. The statement will give he markets the opportunity to learn about the decision-making process in the rate decision earlier in the week. A hawkish statement is bullish for the Australian dollar.
- Retail Sales: Friday, 00:30. The week wraps up with Retail Sales, the primary gauge of consumer spending. The indicator posted a gain of 0.4% in November, matching the forecast. Little change is expected in the December report, with an estimate of 0.5%.
* All times are GMT
AUD/USD Technical Analysis
AUD/USD opened the week at 0.6999 and quickly touched a low of 0.6918. It was all uphill from there, as ,the pair climbed to a high of 0.7141 testing resistance at 0.7100 (discussed last week). The pair closed the week at 0.7081.
Live chart of AUD/USD: [do action=”tradingviews” pair=”AUDUSD” interval=”60″/]
Technical lines from top to bottom:
We begin with resistance at 0.7440. This line capped the pair in August.
0.7284 is next.
0.7100 was tested as the pair posted strong gains. It is currently a weak resistance line and could see further action early in the week.
The round number of 0.70 is providing support. It worked as a cushion in August.
0.6899 has provided support since September. It has some breathing room as the pair trades at higher levels.
0.6775 is the next support level.
0.6686 was an important cap back in January 2000.
0.6532 is the final support level for now.
I am bearish on AUD/USD
The Fed sounded dovish in the January statement, but the markets will be looking for hints as to a March hike, so any positive US data could bolster the US dollar. Key Australian releases will have to meet expectations or the Aussie could slip back below the symbolic 0.70 level.
In our latest podcast we make sense of turbulent markets
Follow us on Sticher or on iTunes
Further reading:
- For a broad view of all the week’s major events worldwide, read the USD outlook.
- For EUR/USD, check out the Euro to Dollar forecast.
- For the Japanese yen, read the USD/JPY forecast.
- For GBP/USD (cable), look into the British Pound forecast.
- For the Canadian dollar (loonie), check out the Canadian dollar forecast.
- For the kiwi, see the NZD/USD forecast
