AUD/USD enjoyed another strong week, gaining 90 points. The pair closed at 0.7912, its highest weekly close since December 2014. The major event this week is CPI. Here is an outlook on the major market-movers and an updated technical analysis for AUD/USD.
In Australia, employment gains slowed, but were still close to the estimate. Over in the US, political risk continues to rise, as Trump’s failure to pass a healthcare bill triggered a fresh wave of US dollar selling. The revelation that Special Counsel Mueller is expanding his investigation into Trump’s business dealings also contributed to the greenback’s losses.
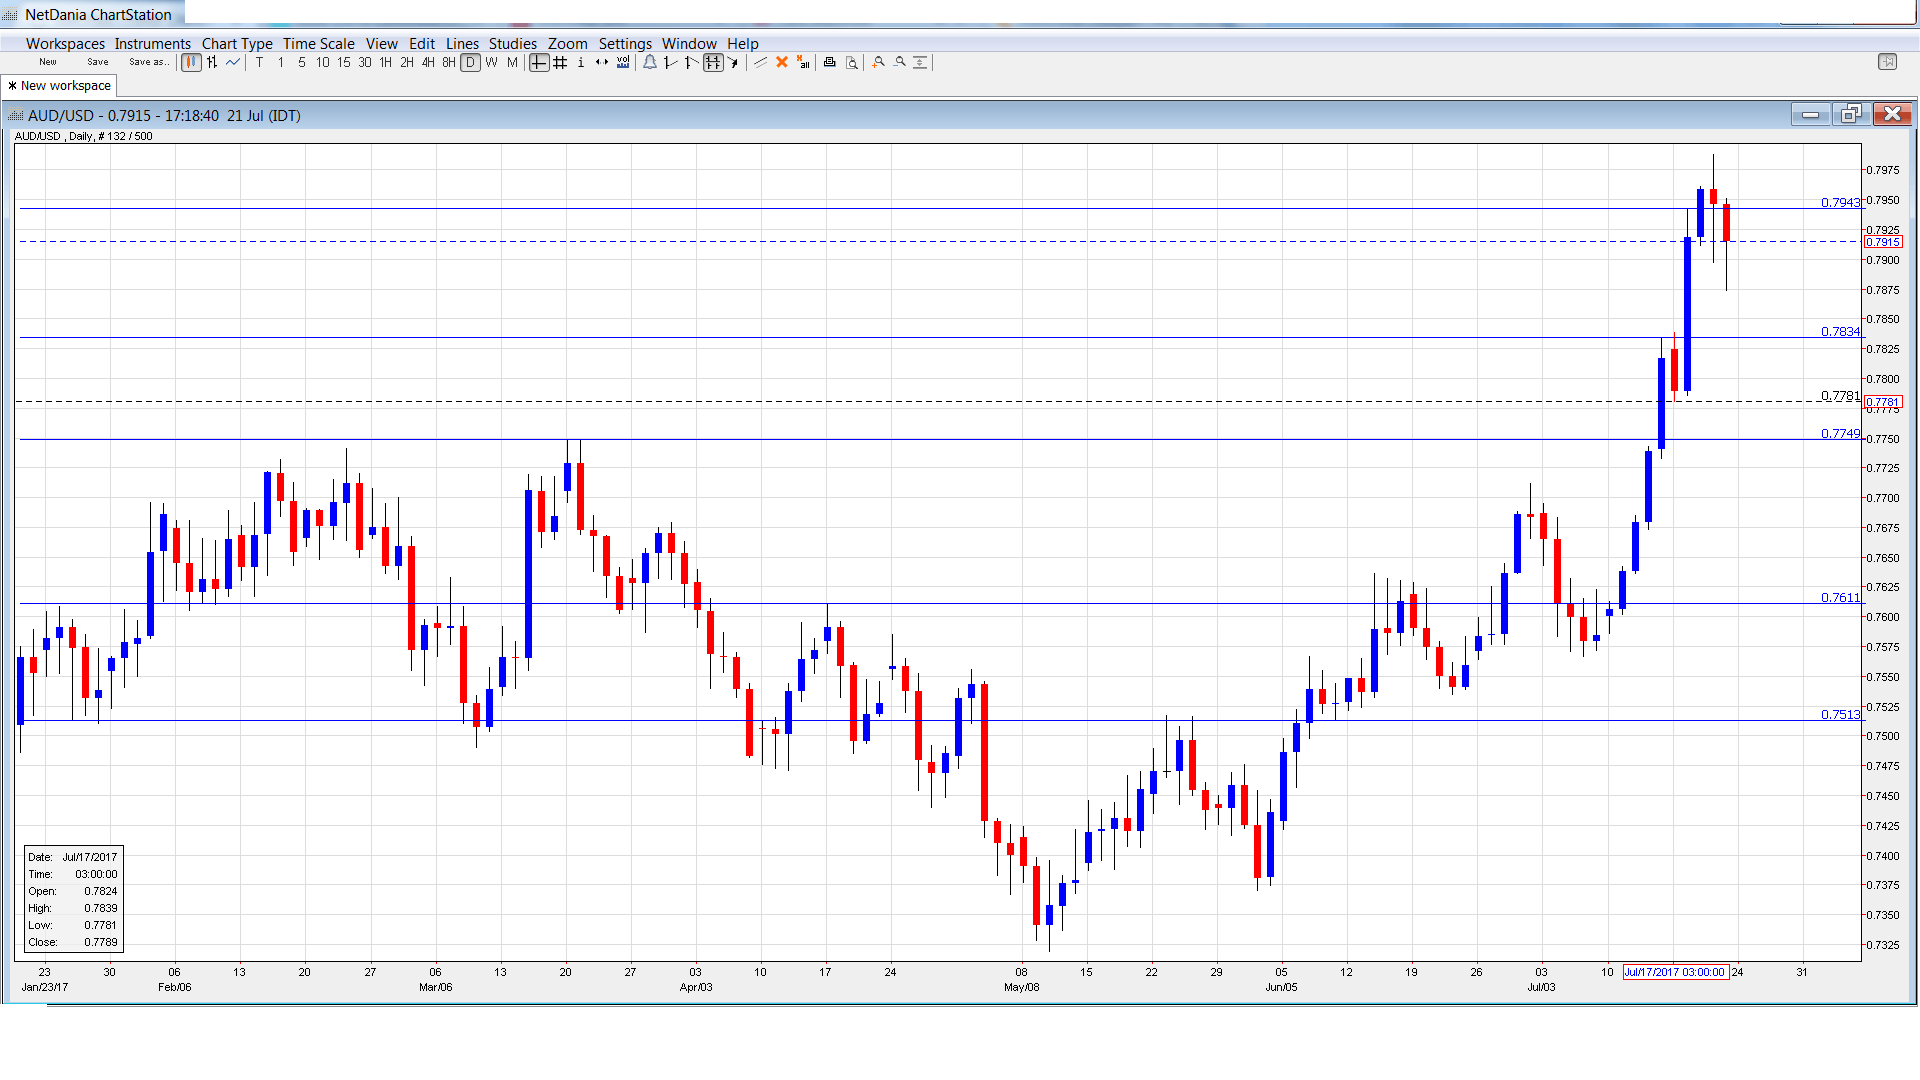
[do action=”autoupdate” tag=”AUDUSDUpdate”/]AUD/USD daily graph with support and resistance lines on it. Click to enlarge:
- CPI: Wednesday, 1:30. CPI is the primary gauge of consumer spending, and an unexpected reading can have a sharp impact on the movement of AUD/USD. In Q1, the index remained unchanged at 0.5%, just below the estimate of 0.6%. The estimate for Q2 stands at 0.4%.
- Trimmed Mean CPI: Wednesday, 1:30. This indicator excludes the most volatile items which comprise CPI. The index improved to 0.5% in Q1, matching the forecast. Another reading of 0.5% is expected in Q2.
- RBA Governor Philip Lowe Speaks: Wednesday, 3:05. Lowe will speak at an event in Sydney. The markets will be looking for clues regarding the RBA’s future monetary policy.
- Import Prices: Thursday, 1:30. Import Prices rebounded in Q1 with a strong gain of 1.2%, crushing the estimate of -0.4%. This marked the highest gain since 2015. The estimate for Q2 is 0.7%.
- PPI: Friday, 1:30. This inflation level is released on a quarterly basis. The indicator was unchanged in Q1, recording a gain of 0.5%. This was above the forecast of 0.3%. The markets are expecting another gain in the second quarter, with a forecast of 0.6%.
AUD/USD Technical Analysis
AUD/USD opened the week at 0.7824 and quickly touched a low of 0.7781. The pair then reversed directions and climbed to a high of 0.7988, as resistance held at 0.8031.
Technical lines from top to bottom:
We start with resistance at 0.8295.
0.8163 has held in resistance since May 2015.
0.8031 is protecting the symbolic 0.80 level.
0.7938 is next.
0.7835 was the high point in April 2016.
0.7749 was an important cap in March.
0.7611 is the next support level.
0.7513 is the final support line for now.
I am bullish on AUD/USD
There are growing doubts that whether the Fed will raise rates in December, with inflation stuck at low levels and mixed numbers for the second quarter. With the Trump administration doing little more than treading water, investors could sour on the US dollar.
Our latest podcast is titled Draghi Dud and the Petrol Pendulum
Follow us on Sticher or iTunes
Safe trading!
Further reading:
- For a broad view of all the week’s major events worldwide, read the USD outlook.
- For EUR/USD, check out the Euro to Dollar forecast.
- For the Japanese yen, read the USD/JPY forecast.
- For GBP/USD (cable), look into the British Pound forecast.
- For the Canadian dollar (loonie), check out the Canadian dollar forecast.
- For the kiwi, see the NZD/USD forecast.
