AUD/USD posted modest losses last week and closed just above the 0.72 line. This week’s key event is CPI. Here is an outlook on the major market-movers and an updated technical analysis for AUD/USD.
The US dollar received some support last week from positive US data, as home sales and jobless claims beat their estimates. Chinese GDP edged lower to 6.9%, but the Australian dollar emerged unscathed, as this figure was higher than the estimate of 6.8%. The Australian dollar tried to move higher, but Friday’s rate cut in China and Draghi’s dovish tone turned into a USD rally and this left the Aussie on the back foot.
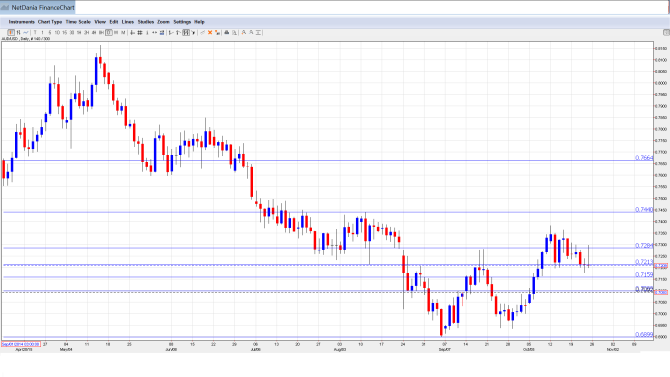
[do action=”autoupdate” tag=”AUDUSDUpdate”/]AUD/USD graph with support and resistance lines on it. Click to enlarge:
- CPI: Wednesday, 00:30. The week kicks off with CPI, the primary gauge of consumer inflation. The index posted a gain of 0.7% in Q2, within expectations. The forecast for Q3 stands at 0.7%.
- Trimmed Mean CPI: Wednesday, 00:30. This index excludes the most volatile items which make up CPI. In Q2, the index posted a gain of 0.6%, matching the forecast. The markets are expecting a gain of 0.5% in the Q3 report.
- HIA New Home Sales: Thursday, 00:00. This indicator provides a snapshot of the level of activity in the housing sector. After a decline in July, the indicator posted a strong gain of 2.3% in August. Will the indicator repeat with another solid reading in September?
- Import Prices: Thursday, 00:30. This is an important indicator, as it is closely linked to inflation levels. The indicator posted a strong gain of 1.4% in Q2, its best performance since Q1 in 2014. The markets are anticipating another strong gain in Q3, with an estimate of 1.6%.
- PPI: Friday, 00:30. PPI measures inflation in the manufacturing sector. The index posted a gain of 0.3% in Q2, which was within expectations.
* All times are GMT.
AUD/USD Technical Analysis
AUD/USD started the week at 0.7259 and climbed to a high of 0.7307. The pair then reversed directions and dropped to a low of 0.7177, breaking through support at 0.7213 (discussed last week). The pair closed at 0.7209.
Live chart of AUD/USD: [do action=”tradingviews” pair=”AUDUSD” interval=”60″/]
Technical lines from top to bottom:
0.7664 is a strong resistance line.
0.7440 capped the pair back in August, and remains key resistance.
0.7284 is a clear separator of ranges, also seen around the same time, and is also stronger.
0.7213 has switched to a resistance role as the pair posted losses last week. It is a weak line, and could see further action early this week.
0.7160 is an immediate support level.
0.71 is the next support line.
The very round level of 0.70 worked as a cushion in August and is under strong pressure.
The round level of 0.69 is the next support line.
0.6775 is the final support level for now.
I am bearish on AUD/USD
Although the Fed stayed on the sidelines in September, a rate hike is still a possibility before the end of the year. Monetary divergence clearly favors the US dollar, and the Australian economy continues to struggle with weaker demand from China, Australia’s largest trade partner.
In our latest podcast we do a Draghi drill down, cover CAD and explain silver investment.
Follow us on Sticher or on iTunes
Further reading:
- For a broad view of all the week’s major events worldwide, read the USD outlook.
- For EUR/USD, check out the Euro to Dollar forecast.
- For the Japanese yen, read the USD/JPY forecast.
- For GBP/USD (cable), look into the British Pound forecast.
- For the Canadian dollar (loonie), check out the Canadian dollar forecast.
- For the kiwi, see the NZD/USD forecast.
