- Bitcoin price prediction points to a V-shaped recovery eyeing $40,000.
- The profit or loss ratio on-chain model reveals that BTC is in the buy zone.
- RSI signalling bulls in driving seat for renewed challenge to major overhead resistance
Our bitcoin price prediction begins by noting the sharp recovery from the massive freefall under $30,000 to post double-digit gains on Wednesday. Support at $29,000 came in handy, allowing bulls to regain balance and stamp their feet down for the ongoing uptrend.
At the time of writing, the bellwether cryptocurrency dodders slightly below $34,500. A comprehensive look at the short-term technical picture shows that buyers have the upper hand. If investors continue streaming into the market, we anticipate a quick liftoff to $40,000.
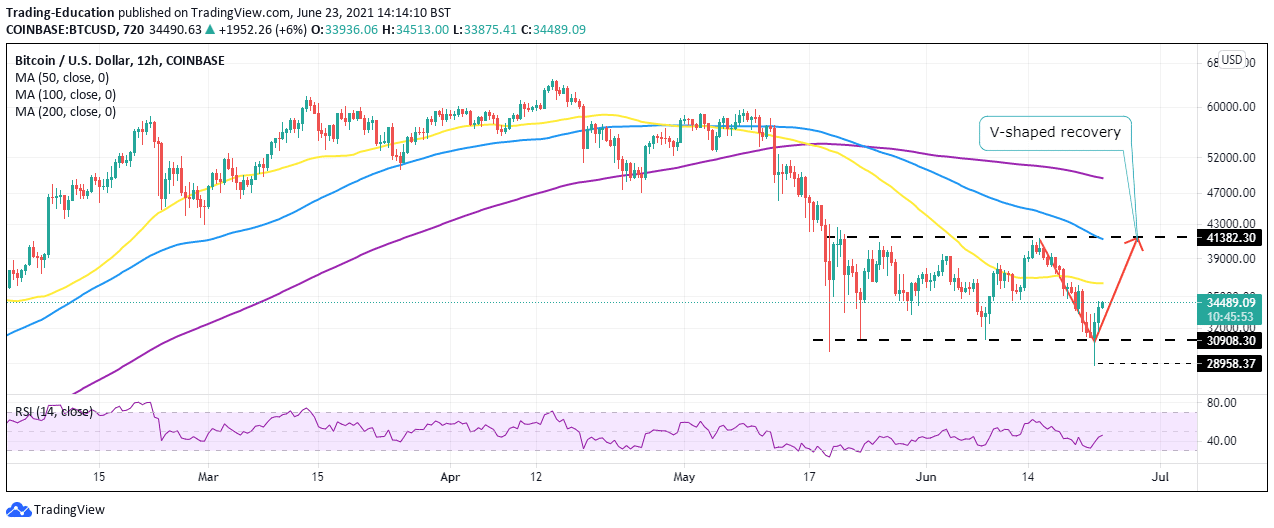
Can Bitcoin Price Sustain This V-Shaped Recovery?
The 12-hour chart illustrates BTC trading a V-shaped recovery. This technical pattern forms after a sharp drop in an asset’s price, followed by an immediate almost vertical uptrend. This type of recovery can be sustained over some time.
However, resistances are often hindrances to its continuation. Therefore, a break above $35,000 and, by extension, the 50 Simple Moving Average (SMA) would boost the uptrend quickly toward $40,000.
BTC/USD 12-Hour Chart: RSI validating bulls?
The TD Sequential indicator identifies positions where an asset’s uptrend or downtrend exhausts itself. For instance, the 12-hour chart reveals a recently presented sell signal in a red nine candlestick. When validated, this signal tells traders when to enter the market. Moreover, it is expected to yield gains in one to four candles on the 12-hour chart.
TD Sequential indicator flashing green
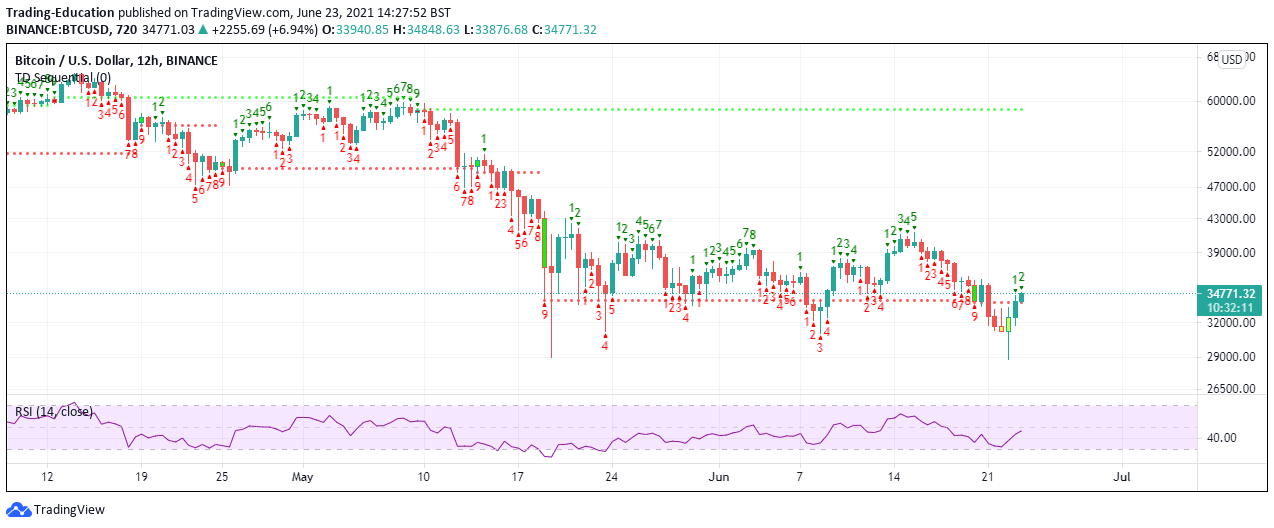
BTC/USD price chart by TradingviewConsequently, the Relative Strength Index (RSI) on the same 12-hour chart validates the bulls’ growing influence in the market. Take note of the recovery from the levels close to the oversold toward the midline. If the RSI steps above the midline and keeps lifting toward the overbought, the bulls’ aggressiveness will be amplified, boosting Bitcoin price action to $40,000.
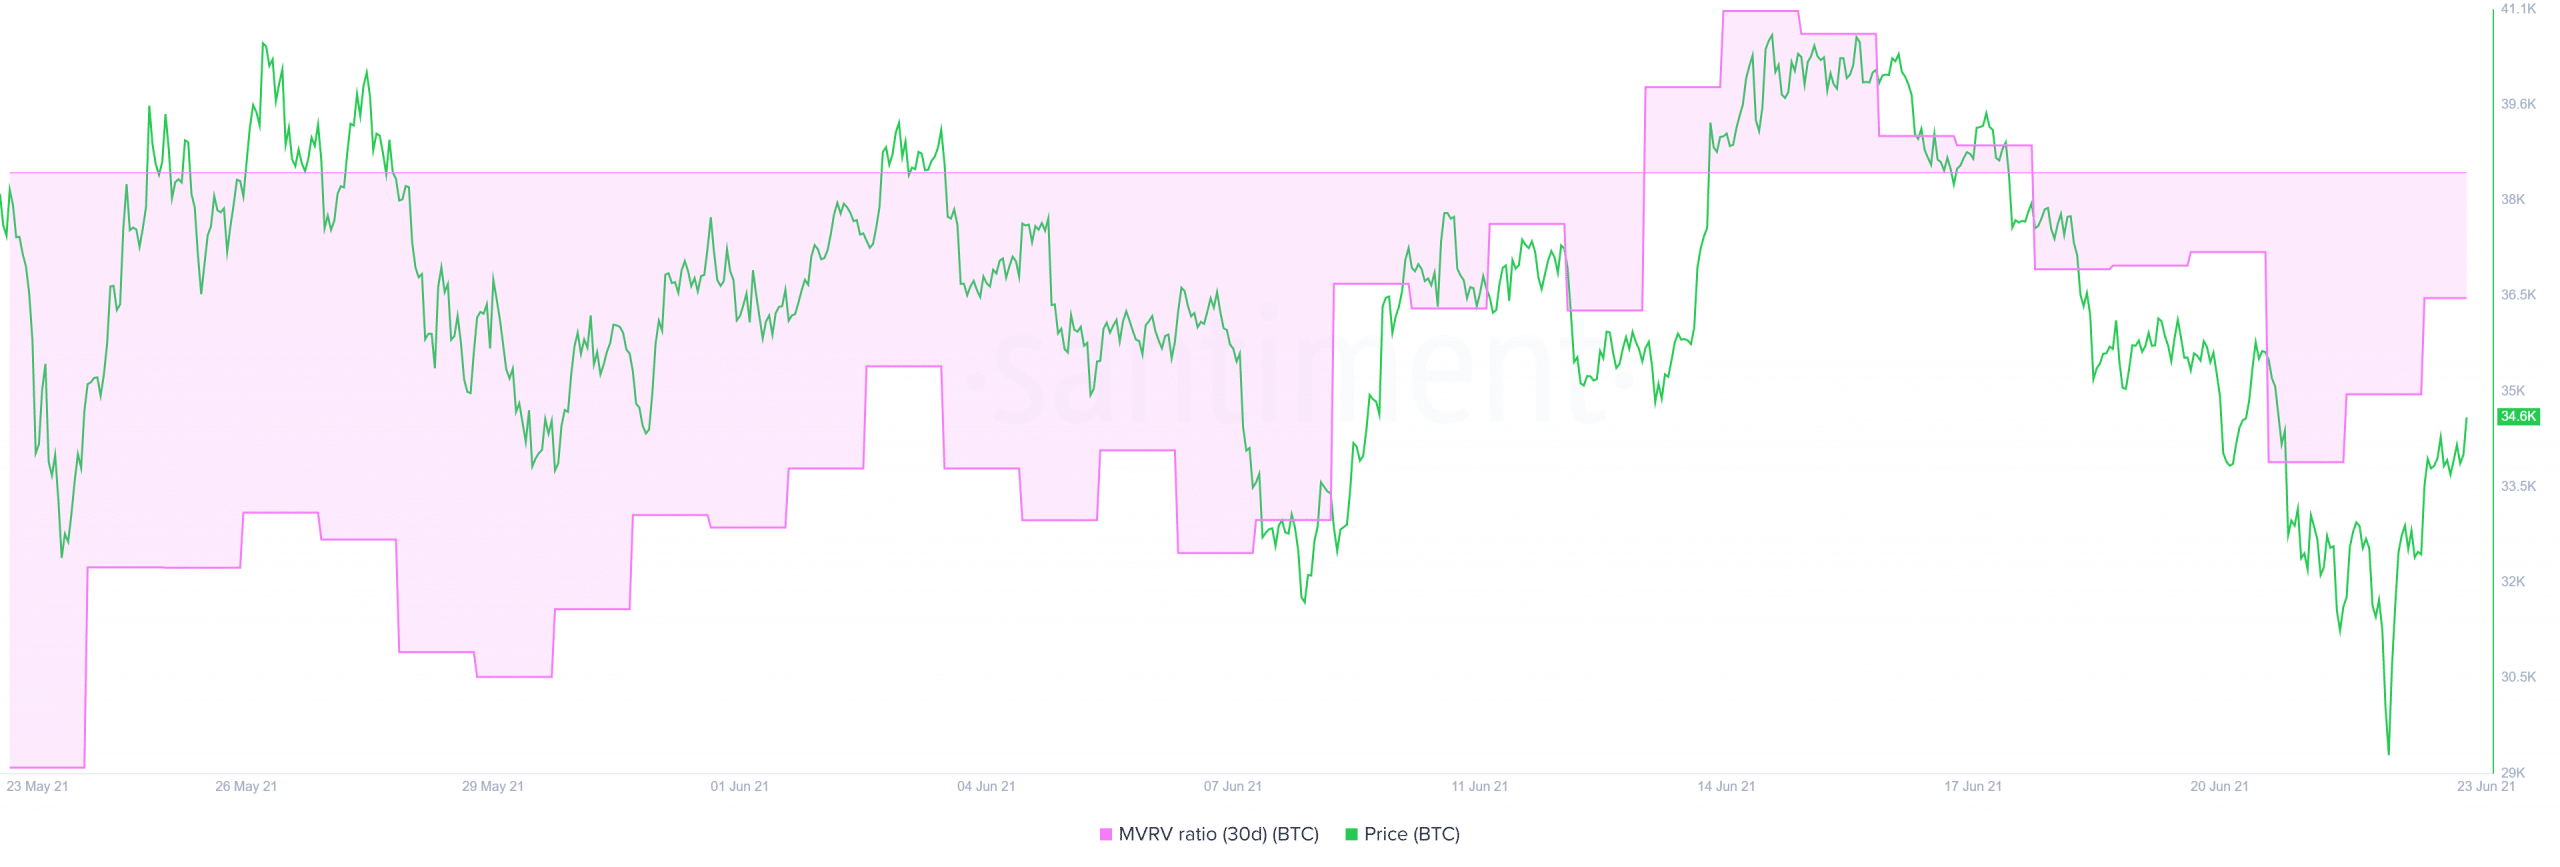
Bitcoin Price Prediction: MVRV On-Chain Model – Uptrend Intact
Bitcoin’s uptrend from the dip to $29,000 seems intact based on the market value realized value (MVRV) on-chain model by Santiment. This model tracks the profit or loss ratio of the holders of BTC moved over the last 30 days compared to the price at which each coin moved last.
An MVRV ratio around 1% or below shows that most holders are at a loss and are unlikely to sell. As the ratio starts to reset upward, more investors buy Bitcoin, speculating on the price hitting higher levels. Therefore, with an MVRV ratio of -5.66%, Bitcoin is in the buy zone awaiting a massive upswing.
It is worth mentioning that Bitcoin’s V-shaped recovery may fail to sustain to $40,000 if the resistance at $40,000 remains unshaken. On the other hand, closing the day under $34,000 may result in overhead pressure rising and jeopardizing the following support at $32,000.
Looking to buy or trade Bitcoin now? Invest at eToro!
Capital at risk