The British pound lost ground against the surging US dollar, but managed to recover somewhat, losing about 100 pips over the course of the week. The upcoming week is quite busy with seven important indicators being released. Highlights include GDP and current account. Here is an outlook for the upcoming events, and an updated technical analysis for GBP/USD.
The eurozone crisis and the global slowdown continue to batter Britain’s weak economy. The Treasury is forecasting that growth in 2011 will be a weak 1.1%, well down from the 2% projection at the beginning of the year. There is a strong chance that the economy will dip into a recession in early 2012. The economic indicators do not paint a pretty picture. Consumer confidence is very low, unemployment is high, at 8.3%, and keys sectors such as retail and manufacturing continue to struggle.
Updates: The situation in Europe is improving, with another successful Spanish auction. In addition, a positive score of 9 points in CBI Realized Sales and a strong Nationwide figure (40 points) pushed cable up above 1.56. Britain prints a high public deficit in November, but continues moving mostly on euro-zone news. The pair fell from 1.5750 to under 1.57. Britain saw a wider current account deficit and an internal revision of GDP figures that didn’t change a lot. GBP/USD remains in range. BBA Mortgage Approvals disappoint and drop to 34.7K. This has a small impact on the pound that enjoys safe haven flows, with record low yields in gilts. Here is how to trade the US New Home Sales with this pair.
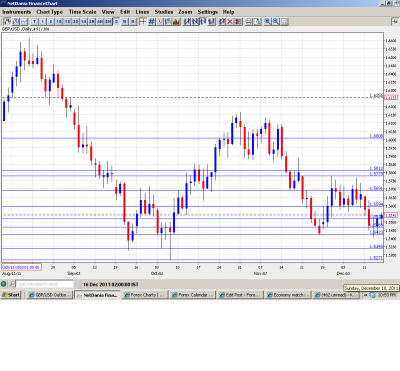
GBP/USD graph with support and resistance lines on it. Click to enlarge:
- Rightmove HPI: Monday, 12:01. The Housing Price index provides analysts with their first look at housing inflation in the UK. After climbing to 2.8% in October, the index fell sharply to -3.1% in November. Will the indicator bounce back into positive territory this month?
- GfK Consumer Confidence: Tuesday, 12:01. The indicator has been well into negative territory for all of 2011, indicating deep consumer pessimism about the economy. Novembers’ reading was a weak -31, and there is little change expected in December, with a forecast of -30.
- CBI Realized Sales: Tuesday, 11:00. This index is based on a survey of retailers and wholesalers, who are asked to rate their currrent sales volume. The index dropped to -19 in November, down from -12 in October. Making matters even worse, the markets had predicted a November figure of -11. This month’s forecast stands at -15. Will the index again surprise the markets with a poor reading?
- Public Sector Net Borrowing: Wednesday, 9:30. The indicator has been in positive territory since August, which means that there has been a budget deficit for three consecutive months. A reading lower than the market prediction is bullish for the pound. November’s figure was at 3.4B, slightly better than the market forecast of 4.1B. However, the December prediction is a sharp rise to 13.5B.
- Current Account: Thursday, 9:30. The reading in October of -2.0B caught the markets by surprise, as the forecast was for -9.7B. This month’s prediction is for a drop to -5.2B. Will the indicator again beat the market prediction?
- Final GDP: Thursday, 9:30. After an impressive second quarter growth of 0.5%, the third quarter numbers came in at only 0.1%. The forecast for the final quarter is up again to 0.5%. Can the indicator keep pace with this rosy forecast?
- BBA Mortage Approvals: Friday, 9:30. Mortgage approvals have hovered around the 35K level over the past few months, and the market forecasts have been fairly accurate. Therefore, traders should not expect the indicator to have much impact on the pound, unless there is an unexpected reading. November’s reading came in at 35.3K, and this month’s forecast is slightly higher at 36.3K.
* All times are GMT.
GBP/USD Technical Analysis
Pound/dollar started the week at 1.5653. The pair climbed then fell all the way to 1.5408, breaching the strong support of 1.5423 (discussed last week)before recovering to end the week at 1.5542.
Technical levels from top to bottom
We start from the round number of 1.60 that served in both directions during 2011. 100 pips below, 1.5882 is the next line of resistance. 1.5815 has proven to be a strong line of resistance. It is followed by the swing low of 1.5780, which worked perfectly well at the end of November, capping an attempt to rise.
1.5690 joins the chart after being the bottom of the crash in November. It capped the pair earlier. This is followed by the round number of 1.56.
The pair dropped below the 1.5520 level, which was the bottom line of the recent range, and had a similar role back in 2010. Further below, 1.5470 which has acted both support and resistance in the past was under attack several times this week.
1.5423, which was a strong support line of late, was breached this week by the pair, which now has its sights on the support line of 1.5340. This is followed by the support line of 1.5270. The next support level is 1.5120, which is the final cushion before the very round number of 1.50.
I remain bearish on GBP/USD.
The economy is Britain is in serious trouble, as shown by various economic indicators. The eurozone debt crisis is still out of control, and the dollar is surging against other currencies. It is unlikely that the pound will be an exception.
Further reading:
- For a broad view of all the week’s major events worldwide, read the USD outlook.
- For EUR/USD, check out the Euro to Dollar forecast.
- For the Japanese yen, read the USD/JPY forecast.
- For the Australian dollar (Aussie), check out the AUD to USD forecast.
- For the New Zealand dollar (kiwi), read the NZD forecast.
- For USD/CAD (loonie), check out the Canadian dollar.
- For the Swiss Franc, see the USD/CHF forecast.

