GBP/USD moved upwards this week, punching through the 1.58 level, to close at 1.5820.The upcoming week has six releases, Here is an outlook for the upcoming events, and an updated technical analysis for GBP/USD.
There was some positive economic data out of the UK this week, such as the 0.9% jump in retail sales. However, with unemployment stubbornly high at 8.4% and weak activity in the manufacturing and housing sectors, the UK economy is still in trouble.
Updates: Rightmove HPI showed a surprising jump of 4.1% in prices. This is certainly good news for the troubled housing sector. Together with some optimism from Brussels, GBP/USD rose to 1.5880 before descending. Hope for Greece is slowly eroding. A deal was reached for Greece, but doubts remain. In Britain, two members preferred a larger expansion of QE. This sank the pound to around 1.57. The pair found a bottom at 1.5640 and managed to climb back above 1.57. BBA Mortgage Approvals exceeded expectations and rose above 38K. See how to trade the British GDP with GBP/USD.
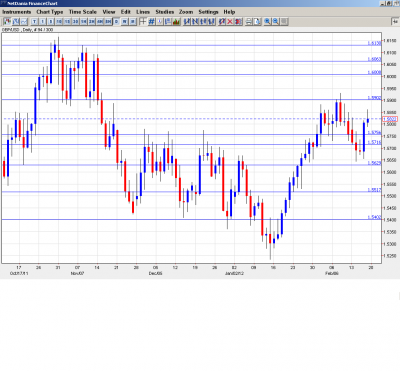
GBP/USD graph with support and resistance lines on it. Click to enlarge:
-
Rightmove HPI: Monday, 00:01. This index provides the earliest data on housing inflation in the UK. The index has shown stronger numbers for three straight months, but is still in contraction mode, with a January reading of -0.8%. Will the index climb into positive territory this month?
-
Public Sector Net Borrowing: Tuesday, 9:30. The UK budget deficit decreased dramatically last month, dropping from 15.2B in December to 10.8B in January. This month’s market forecast is calling for a large surplus of -8.9B, which seems very optimistic, given the weak UK economy.
-
BBA Mortgage Approvals: Thursday, 9:30. Mortgage Approvals is an important indicator of housing market demand. Last month’s figures were 36.2K, and a very slight increase is predicted for February, indicating a bit of improvement in the weak housing sector.
-
CBI Industrial Order Expectations: Thursday, 11:00. After an awful reading of -23 in December, the indicator improved to -16 last month. The market forecast for February predicts an improvement, but only to -13. This figures are further confirmation that the manufacturing sector is very weak. If the indicator can continue the upward trend and beat the market forecast, this would be bullish for the pound.
-
Revised GDP: Friday, 9:30. GDP is released quarterly, and this important indicator is often a market-mover. After a strong 0.5% increase in November, the markets are predicting a 0.2% drop. This would be the first contraction in a year, and any dip into negative territory is sure to get the market’s attention, and could hurt the pound. Traders should keep in mind that the market forecasts for GDP are quite accurate, so the chances of a drop in GDP this month are high.
-
Preliminary Business Investment: Friday, 9:30. This indicator focuses on capital investment. It tends to be volatile, with the result that the market forecasts are often way off. The forecast for February calls for a contraction of 0.4%, which would be the sixth straight drop by the indicator. Will the indicator surprise the markets and rebound with a reading in positive territory?
* All times are GMT.
GBP/USD Technical Analysis
Pound/dollar started the week at 1.5777. The pair dropped to a low of 1.5644, close to the resistance line of 1.5629 (discussed last week). It then changed direction, rising as high as 1.5862. The pair closed the week slightly higher, at 1.5822.
Technical levels from top to bottom
We begin with the strong resistance level of 1.6472, which has not been tested since August 2011. The next line of resistance is at 1.6426. This is followed by resistance at 1.6265. Next, 1.6132 has provided strong resistance since November of last year. Below, there is resistance at 1.6065, followed by strong resistance at the psychologically important figure of 1.60. The line of 1.59 is next to provide resistance to the pair.
With some strong movement by GBP/USD this week, the important line of 1.5755 was tested. It is currently acting as weak support for the pair. The next line of support is close by at 1.5720, and this line could fall on a further downward swing by the pair. Below, 1.5629 held fast this week and is an important support level. Next, 1.5520 is providing strong support. Finally, the round number of 1.54, which served as strong support in November and December 2011, is again providing support to the pair.
I remain bullish on GBP/USD.
Despite the lackluster economic data coming out of the UK, the pound has had a spectacular 2012, and the upward swing against the dollar could well continue. For the time being at least, the pound continues to shine.
Further reading:
- For a broad view of all the week’s major events worldwide, read the USD outlook.
- For EUR/USD, check out the Euro to Dollar forecast.
- For the Japanese yen, read the USD/JPY forecast.
- For the Australian dollar (Aussie), check out the AUD to USD forecast.
- For the New Zealand dollar (kiwi), read the NZD forecast.
- For USD/CAD (loonie), check out the Canadian dollar forecast.
- For the Swiss Franc, see the USD/CHF forecast.

