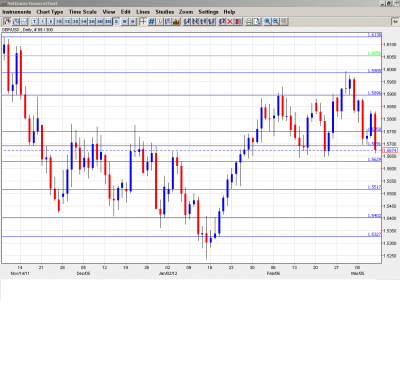
GBP/USD dropped 150 pips, closing the week at 1.5675 level. The upcoming week has four releases. Here is an outlook for the upcoming events, and an updated technical analysis for GBP/USD.
US non-farm payrolls posted strong numbers in January and February, helping the dollar rally. Meanwhile, economic data coming out of the UK continued to unimpress the markets.
Updates: PPI Input jumped 2.1%, a nine-month high. Manufacturing Production was flat, rising just 0.1%. Trade Balance dropped to -7.5B. CB Leading Index was up 0.9%, its highest level since May 2010. Unemployment Claimant Count Change was up 7.2K, a five-month high. The unemployment rate remained steady at 8.4%. Average Earnings Index rose by 1.7%, its lowest reading since August 2010. GBP/USD dropped below 1.57, trading at 1.5666.
GBP/USD graph with support and resistance lines on it. Click to enlarge:
-
RICS House Price Balance: Tuesday, 12:01. This diffusion index is based on a survey of property surveyors. The February reading came in at a weak -16%. The market forecast for March calls for a slight improvement, to -13%. This figure, although indicative of continuing contraction in the housing sector, would actually be the index’s highest reading in almost two years. Traders should note that the market forecasts are usually, though not always, accurate.
-
Trade Balance: Tuesday, 9:30. The UK trade balance recorded a 7.1B deficit in February, which was much better than the 8.5B deficit predicted by the market. The March forecast calls for a higher deficit, of 7.8B. Will the index again beat the market prediction?
-
CB Leading Index: Tuesday, 10:00. This composite index is based on seven economic indicators. The index has been stuck in negative territory since September 2011. The February reading came in at -0.5%, and no significant change is expected for the March reading.
-
Claimant Count Change: Wednesday, 9:30. Unemployment claims shot up 6.9K, disappointing the markets which had predicted a rise of 3.2K. The forecast for March is little changed, with a prediction of a rise of 6.9K. The unemployment rate in February stood at 8.4%, and the forecast for March is unchanged.
* All times are GMT.
GBP/USD Technical Analysis
Pound/dollar started the week at 1.5830. The pair then rose to a high of 1.5882, as the resistance line of 1.59 (discussed last week) held firm.The pair then dropped sharply, falling as low as 1.5661. Pound/dollar closed the week at 1.5674.
Technical levels from top to bottom
We begin with the strong resistance level of 1.6265. Next, 1.6132 has also provided strong resistance, since November 2011. Below, there is resistance at 1.6065. Next, there is strong resistance at 1.5987, just shy of the psychologically important line of 1.60. This is followed by the round number of 1.59, which is currently a weak resistance line. Below, 1.5750, which was breached by the pair on its downswing this week, is now providing resistance to GBP/USD. Next, 1.5696 is providing weak resistance, and could be breached again on an upward swing by the pair. This is followed by 1.5629, which has held fast as a support line since late January. Next, 1.5520 is providing support. Below is the round number of 1.54, which served as strong support in November and December 2011, and is again providing support to the pair. The final support line for now is at 1.5336.
I remain neutral on GBP/USD.
GBP/USD was pointed downward this week, as the dollar showed some strength. However, the pair has been quite choppy, which could continue until the financial crisis in the eurozone, particularly in Greece, settles down.
Further reading:
- For a broad view of all the week’s major events worldwide, read the USD outlook.
- For EUR/USD, check out the Euro to Dollar forecast.
- For the Japanese yen, read the USD/JPY forecast.
- For the Australian dollar (Aussie), check out the AUD to USD forecast.
- For the New Zealand dollar (kiwi), read the NZD forecast.
- For USD/CAD (loonie), check out the Canadian dollar forecast.
- For the Swiss franc, see the USD/CHF forecast.

