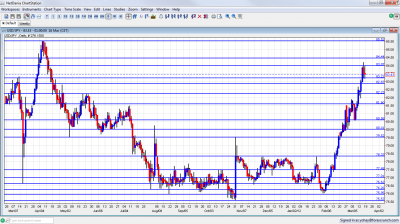
$/yen continued higher for a sixth week in a row, and is approaching a one year high. Trade balance is the major event this week. Here’s an outlook for the Japanese events and an updated technical analysis for USD/JPY.
Ben Bernanke’s relative bullishness certainly helped the pair. The Fed discusses rising prices and recognizes employment improvement. Last week, the Bank of Japan decided to continue its “powerful easing” in order to achieve a 1% inflation target however rejected the plan to increase its asset purchase program by another 5 trillion yen. The BoJ policy board is waiting to see the impact of the ¥10 trillion asset purchase addition voted for in February to see whether further asset purchases are required.
Updates: USD/JPY is down slightly, trading at 83.12. The pair continues to move upwards following the Federal Reserve speech, trading at 83.73. . All Indutries Activities fell sharply, posting a 1% loss. Trade Balance improved, but still recorded a deficit of 0.31T.
USD/JPY daily chart with support and resistance lines on it. Click to enlarge:
- All Industries Activity: Wednesday, 4:30. Japanese all industry activity gained 1.3% in December recovering from November’s 1% drop, however the increase was below the 1.5% growth expected by analysts. Building activity declined 1.9% spoiling the 1.9 % rise in November but industrial production expanded 3.8 %. A drop of 0.5% is expected now.
- Trade Balance: Wednesday, 23:50. The adjusted trade balance revealed a deficit of 612.8 billion yen in January which is lower than the 830 billion deficit predicted by analysts after the downwardly revised deficit of 569.7 billion yen in December. Furthermore Japan’s annual merchandise trade deficit hit record high in January with a deficit of 1.475 trillion yen suggesting major hardships in Japan’s struggling economy. A smaller deficit of 0.34trillion is predicted.
* All times are GMT
USD/JPY Technical Analysis
Dollar/yen renewed its climb, but couldn’t get too far at the beginning. After crossing the 82.87 line (mentioned last week, it made a fast run, before settling in a range between 83.20 and 84.
Technical lines from top to bottom
We start from much higher ground this time. 88.12 capped the pair back in July 2010, and also worked beforehand as support. It is followed by the round number of 87, which worked as support back then, and is minor resistance now.
86.27 was a distinct line of support and resistance in the summer of 2010 and is the next line if 85.50 is crossed. 85.50 is a key line. This was a peak after a strong move in March 2011. It held for more than one day.
84.50 capped the pair at the end of 2010 and at the beginning of 2011 and is a bit weaker now. An important line of resistance is found at 84, which capped the pair back in February 2011 and provided some resistance in March 2012.
It is closely followed by minor support at 83.20, which was the bottom border of a range in March, and also provided resistance in February 2011. 82.87 was the line where the BOJ intervened in September 2010, and also worked in both directions afterwards.
82.20 was a stubborn peak in May 2012 and is now closer. It is likely to be strong resistance. 81.60 served as a temporary cap in March 2012 and is now a minor support line .
80.60 provided support for the pair around the same time, and served as a bouncing spot for the next moves. The round number of 80, which provided strong support in June, is the next line, and it is of high importance.
79.50, was a battleground on the way up. This is the line that was reached after the last non-stealth intervention. 78.30 capped a second recovery attempt in November, after the intervention and had an important role earlier as well, working as support. After it was broken, the rally intensified. It now switches to support.
I remain bullish on USD/JPY.
The higher US yields, combined with the Fed bullishness, weigh against the Japanese QE and the current account deficit. This pair felt the dollar storm quite strongly.
Further reading:
- For a broad view of all the week’s major events worldwide, read the USD outlook.
- For EUR/USD, check out the Euro to Dollar forecast.
- For GBP/USD (cable), look into the British Pound forecast.
- For the Australian dollar (Aussie), check out the AUD to USD forecast.
- For the New Zealand Dollar (kiwi), read the NZD forecast.
- For USD/CAD (loonie), check out the Canadian dollar forecast
- For the Swiss Franc, see the USD/CHF forecast.
