The Canadian dollar continued retreating against the soaring greenback, as European fears helped the USD and pushed oil prices lower. Retail sales are the highlight of this week. Here’s an outlook for the Canadian events and an updated technical analysis for the Canadian dollar.
Canadian manufacturing sales soared in March amid an unexpected 1.9% boost in sales following a 0.2% contraction in February pulling the economy back on a growth track. This rebound came amid a rise in petroleum and coal products. With a strong labor market and a recovering manufacturing sector Canada has a lot to look forward to.
Updates: Core CPI rose 0.4%, beating the maket estimate of 0.2%. The loonie has lost almost 2 cents in the past week to the surging US dollar. The pair is testing the 1.02 line, and was trading at 1.0199. The markets were closed for a national holiday on Monday, and USD/CAD showed little change, trading at 1.0182. The markets will have three releases to digest on Wednesday, including Core Retail Sales, a key indicator. The market forecast calls for a 0.5%, the same as the April reading. The loonie continues to sag, as USD/CAD was trading at 1.0225. Core Retail Sales disappointed, increasing by only 0.1%. The estimate stood at 0.5%. Retail Sales came in at 0.4% and the Leading Index at 0.3%. Both these readings that matched the market forecast. The USD/CAD was slightly higher, trading at 1.0241.
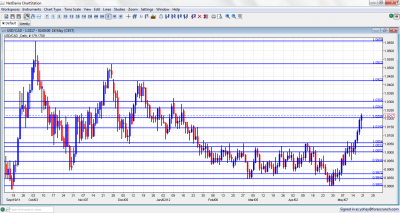
USD/CAD daily chart with support and resistance lines on it. Click to enlarge:
- Retail sales: Wednesday, 12:30 Following January’s car sale boost Canadian consumers bought less cars sales in February reducing retail sales by 0.2%. Meanwhile, Core sales excluding the automobile industry increased 0.5% after a 0.8% decline in January. Sales of gasoline increased while sales of food and beverages dropped. Retail sales are expected to rise 0.4% while Core sales are predicted to climb 0.6%.
- Leading Index: Wednesday, 12:30.Canada’s composite leading indicator increased 0.4% in March. This was the ninth consecutive rise following a 0.7% gain in February. Eight of the indicator’s 10 components improved in March suggesting improvement in Canadian economic activity. A smaller rise of 0.3% is forecasted now.
- Corporate Profits: Thursday, 12:30. Profits of Canadian corporations increased edged up 9.0% $71.4 billion at the fourth quarter of 2011 after a 0.5% decline in the third quarter. 15 of 22 industries reported higher profits in the fourth quarter.
* All times are GMT.
USD/CAD Technical Analysis
$/C$ began with trading between parity and the 1.0050 line (discussed last week). It then surrendered, broke above 1.0050 and continued north from there, eventually even breaking the 1.02 line.
Technical lines, from top to bottom:
We move higher once again. 1.0750 was the peak of ranges several times in the past few years, and is a very important line. 1.0660 was last seen in September 2011, but this line was also a long running swing high several times beforehand.
1.0523 was a peak back in November and is minor resistance.. 1.0423 is the high line that capped the pair towards the end of 2011 and remains far in the distance.
The round number of 1.03 was resistance at the beginning of the year. 1.0263 is the peak of surges during the last quarter of 2011, but was damaged after the move higher. It’s getting closer and works as key resistance.
The round figure of 1.02 was a cushion when the pair dropped in November, and also the 2009 trough. It is weaker now but remains pivotal after being broken. 1.0143 was a swing low in September and worked as resistance several times afterwards. In the battle lines around parity,
1.0050 was tough resistance in April 2012 and also in May. Very close by, 1.0030 capped the pair twice in March 2012 but is weaker now after working only temporarily in May.
The very round number of USD/CAD parity is a clear line of course, and the battle is renewed after the recent climb. Under parity, we meet another pivotal line at 0.9950. It served as a top border to range trading in March 2012 and later as a line in the middle of the range.
0.99, the round number is now present on the graph after capping the pair in May 2012. 0.9840 provided support for the pair during September and was reduced to a minor line now.
The round number of 0.98 is key support that was tested twice during the downfall. It’s strong.
I am neutral on USD/CAD.
While the Canadian dollar is relatively resilient to events in Europe, it is still retreating. In addition, weak figures from the US, such as the Philly Fed Index, also put US demand in question, and this is key to Canadian growth.
Further reading:
- For a broad view of all the week’s major events worldwide, read the USD outlook.
- For EUR/USD, check out the Euro to Dollar forecast.
- For the Japanese yen, read the USD/JPY forecast.
- For GBP/USD (cable), look into the British Pound forecast.
- For the Australian dollar (Aussie), check out the AUD to USD forecast.
- For the New Zealand Dollar (kiwi), read the NZD forecast.
- For USD/CAD (loonie), check out the Canadian dollar forecast
- For the Swiss Franc, see the USD/CHF forecast
