The Canadian dollar continued gaining against the greenback, but eventually retreated, as tough resistance held. Will the falling price of oil hurt push USD/CAD higher? GDP is the highlight of this week. Here is an outlook on the major market-movers an updated technical analysis for USD/CAD.
The absence of QE3 from the Fed’s decision also weighed on the loonie. Mixed results were released last week with a jump in Foreign Securities Purchases rising to 10.20 billion compared to a 2.40 billion decline in March; Wholesale Sales edged up 1.5% in April following 0.4% in March while expected to grow 0.4%. However Retail sales disappointed with 0.55 decline and Core sales with a drop of 0.3%.
Updates: Last week’s Core CPI reading dropped to 0.2%, below the market forecast of 0.3%. CPI was well below the estimate of 0.2%, declining by 0.1%. The loonie has lost ground, as USD/CAD was trading at 1.0287. It is a very quiet week as far as economic data, with no scheduled releases until Friday. The loonie has strengthened very slightly, as USD/CAD has moved to the mid-1.02 range. The pair was trading at 1.0258. The loonie was unchanged in Wednesday’s trading, as USD/CAD was trading at 1.0250. We could see movement by the pair following two key releases in the US on Wednesday, Core Durable Goods Orders and Pending Home Sales. With US data continuing to be a mixed bag, USD/CAD did break out in either direction. The pair did edge downwards, as USD/CAD was trading at 1.270.
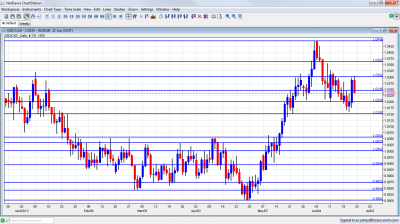
USD/CAD daily chart with support and resistance lines on it. Click to enlarge:
- GDP: Friday, 12:29.Canada’s economy grew at a modest rate of 0.1% in the first quarter, less than the 0.4% expansion rate expanded. GDP grew 1.96% in the quarter on an annual base, below the BOC prediction of a 2.5% growth rate. The report suggests a slow pace of growth. Business investment and inventories were the biggest contributor to the quarterly advance. 0.2%
- RMPI: Friday, 12:30. Raw Materials Price Index dropped 2.0% in April, following declines of 0.6% in February and 1.7% in March. The main cause for this drop is a decrease in energy product prices. On a yearly base RMPI declined 13.6%, its second consecutive decrease. Meanwhile Industrial Product Price Index (IPPI) was unchanged in April. Raw Materials Price Index is expected to gain 2.3% while Industrial Product Price Index is predicted to rise by 0.4%.
* All times are GMT.
USD/CAD Technical Analysis
Dollar/CAD was ranging during the week between the 1.0150 and the 1.03 lines mentioned last week. It eventually closed at 1.0235.
Technical lines, from top to bottom:
We start from lower ground this time. 1.0750 was the peak of ranges several times in the past few years, and is a very important line. 1.0660 was last seen in September 2011, but this line was also a long running swing high several times beforehand.
1.0523 was a peak back in November and is minor resistance. 1.0460 capped the pair in June 2012 and also had a minor role in the past. It is now high resistance.
1.0360 was a pivotal line in June 2012 and is now significant resistance. The round number of 1.03 was resistance at the beginning of the year and now returns to this role. It worked perfectly well during June – over and over again. It is a critical line.
1.0245 served as a separator for the move up when the pair rallied in May 2010 but is weaker now. The round figure of 1.02 was a cushion when the pair dropped in November, and also the 2009 trough. It is weaker once again after being battered lately.
1.0150 was a swing low in September and worked as resistance several times afterwards. It was challenged in June 2012. Very close by, 1.0030 capped the pair twice in March 2012 but is weaker now after working only temporarily in May.
The very round number of USD/CAD parity is a clear line of course, and the battle is renewed after the recent climb.
Under parity, we meet another pivotal line at 0.9950. It served as a top border to range trading in March 2012 and later as a line in the middle of the range.
0.99, the round number is now present on the graph after capping the pair in May 2012. 0.9840 provided support for the pair during September and was reduced to a minor line now.
Lower, 0.9725 worked as strong support back at the fall of 2011. The last line for now is 0.9667, which was another strong cushion in the past.
I remain bullish on USD/CAD.
With new worries about a housing bubble in Toronto, falling prices of oil, weakening US demand and especially no QE3 in the US, the dollar has room for more gains.
Further reading:
- For a broad view of all the week’s major events worldwide, read the USD outlook.
- For EUR/USD, check out the Euro to Dollar forecast.
- For the Japanese yen, read the USD/JPY forecast.
- For GBP/USD (cable), look into the British Pound forecast.
- For the Australian dollar (Aussie), check out the AUD to USD forecast.
- For the New Zealand Dollar (kiwi), read the NZD forecast.
- For USD/CAD (loonie), check out the Canadian dollar forecast
- For the Swiss Franc, see the USD/CHF forecast
