The Canadian dollar enjoyed the greenback’s weakness to make some gains, but didn’t reach parity. At least not yet. Retail sales is the major event this week. Here is an outlook on the major market-movers and an updated technical analysis for USD/CAD.
Last week, the Bank of Canada announced that the overnight rate will remain at 1.0% until next year. Foreign Securities Purchases continues to grow above expectations reaching 26.11 billion in May, compared to 10.2 billion in the previous month, and Wholesale Sales topped predictions by rising 0.9% in May following 1.2% gain in the previous month. These optimistic figures suggest a growth trend in the Canadian economy.
Updates: Core CPI and CPI were released at the end of last week. Both indexes came in below the market forecasts, as each declined by 0.4%. The loonie is down slightly to start the trading week. USD/CAD was trading at 1.0163. Core Retail Sales and Retail Sales will be released later on Tuesday. The markets are predicting that both indicators will improve this month. The loonie weakened slightly, as USD/CAD continues to move towards the 1.02 line. The pair was trading at 1.0194. Core Retail Sales was up sharply, as it jumped 0.5%. This was well above the market estimate of a 0.1% gain. Retail Sales increased by 0.3%, just below the forecast of 0.4%. USD/CAD was unchanged, trading at 1.0188. There were no economic releases on Thursday, but the loonie posted some gains following weak US housing data, as there is speculation that the US Federal Reserve may take action to help the US economy. USD/CAD dropped below the 1.01 line, as the pair was trading at 1.0095.
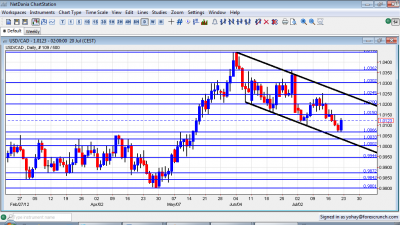
USD/CAD daily chart with support and resistance lines on it. Click to enlarge:
- Retail sales: Tuesday, 12:30. Canadian retail sales dropped unexpectedly 0.5% in April from a 0.4% gain in the previous month, while economists predicted an increase of 0.3%. This disappointing figure indicates a slowdown in growth and consumer spending. Meantime Core sales excluding automobile sales also declined by 0.3%, defying expectations for a 0.2% increase. Lower sales were reported in 8 of 11 categories. Retail sales is expected to rise 0.3% while Core sales is forecasted to gain 0.2%.
* All times are GMT.
USD/CAD Technical Analysis
Dollar/C$ made three attempts to recover above the 1.0150 line (mentioned last week). The last attempt resulted in a downfall and the pair closed at 1.0123 after finding support at 1.0066.
Technical lines, from top to bottom:
1.0750 was the peak of ranges several times in the past few years, and is a very important line. 1.0660 was last seen in September 2011, but this line was also a long running swing high several times beforehand.
1.0523 was a peak back in November and is minor resistance. 1.0460 capped the pair in June 2012 and also had a minor role in the past. It is now high resistance.
1.0360 was a pivotal line in June 2012 and is now significant resistance. It proved its strength in June 2012. The round number of 1.03 was resistance at the beginning of the year and now returns to this role. It worked perfectly well during June – over and over again, until finally being run through.
1.0245 served as a separator for the move up when the pair rallied in May 2010 and regains some strength now, thanks to capping the pair in July 2012. The round figure of 1.02 was a cushion when the pair dropped in November, and also the 2009 trough. It is now becoming stronger once again after stopping a rise in July.
1.0150 was a swing low in September and worked as resistance several times afterwards. It was challenged in June 2012. and served as a separator in July 2012. This continues to be a key line to watch.
1.066 is key support before parity. It’s strength during July 2012 was clearly seen. The very round number of USD/CAD parity is a clear line of course, and the battle is renewed after the recent climb.
Under parity, we meet another pivotal line at 0.9950. It served as a top border to range trading in March 2012 and later as a line in the middle of the range.
0.99, the round number is now present on the graph after capping the pair in May 2012. 0.9840 provided support for the pair during September and was reduced to a minor line now.
Lower, 0.9725 worked as strong support back at the fall of 2011. The last line for now is 0.9667, which was another strong cushion in the past.
Downtrend Channel
As you can see on the graph, the pair is trading in a downwards channel that began at the beginning of June. Downtrend support is more significant than downtrend resistance. The channel continues to hold.
I remain bearish on USD/CAD.
Even if the US dollar stages a recovery, it will have a hard time battling the loonie, which continues to enjoy back wind from a strong economy and now with rising oil prices.
Further reading:
- For a broad view of all the week’s major events worldwide, read the USD outlook.
- For EUR/USD, check out the Euro to Dollar forecast.
- For the Japanese yen, read the USD/JPY forecast.
- For GBP/USD (cable), look into the British Pound forecast.
- For the Australian dollar (Aussie), check out the AUD to USD forecast.
- For the New Zealand Dollar (kiwi), read the NZD forecast.
- For USD/CAD (loonie), check out the Canadian dollar forecast
- For the Swiss Franc, see the USD/CHF forecast
