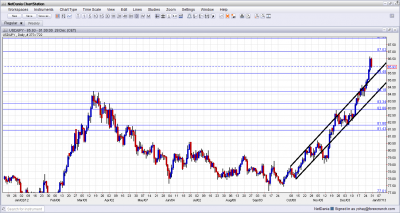
Dollar/yen continued to rally and now reached levels last seen over 2 years ago, as the new Japanese government entered office. The pair even broke above the rising channel. The Japanese markets will be closed this week and no indicators are released. So, the outlook is only an updated technical analysis for USD/JPY.
Shinzo Abe returned to the premier’s office and did not lower his tone regarding fighting deflation: the BOJ leaders can either comply or lose their jobs. Where will the rally stop? There are various estimations, ranging from 90 or 100 to a sharp turnaround.
Updates: The Japanese markets remains closed for holidays, and there are no releases scheduled for this week. The yen continues to slump, and has crossed above the 87 line. USD/JPY was trading at 87.05. The yen has improved slightly, as USD/JPY dipped below the 87 line. The pair was trading at 86.80.
USD/JPY daily chart with support and resistance lines on it. Click to enlarge:
USD/JPY Technical Analysis
$/ ¥ began the week with securing the 84.20 line (mentioned last week). It then continued higher and reached a 2 year high by crossing the 85.50 line. After peaking at 86.63 the pair fell and closed at 85.93.
Technical lines from top to bottom
We begin from higher ground this time. The ultimate resistance line for now is 90 – a target marked by many analysts and a round number. Below, 89.10 was a peak in the summer of 2010, before the pair began descending.
88 was a swing low in 2010, and later served as resistance.
86.27, which served as resistance, also in 2010 is weakening now. 85.50 is a high peak seen back in early 2011.
84.20 is a more recent swing high, seen in early 2012. This is now critical resistance for any move forward.An initial move above this line in December 2012 turned into a false break. It is followed by 83.34 which capped the pair in April and also beforehand. It switched to support after the surge in December.
82.87 is a veteran line – that’s where the BOJ intervened for the first time back in 2010. The line also capped the pair during November and December 2012.
81.80 capped the pair in April, and is the level of the “shoulders” in the upwards thrust seen at the time. It worked perfectly well as support in December 2012. 81.43 is stronger after serving as resistance for a recovery attempt back in 2011, and capped a move higher in November 2011.
80.70 worked as resistance back in June and in a stronger manner in October. It turns into support now. The round number of 80 is psychologically important, even though it was crossed several times in recent months.
79.70 was a cap was seen in June 2012. It proved its strength as resistance once again in July 2012 and proved critical before the downfall in August 2012. It strengthens again after capping the pair during November 2012.. 79.05 capped the pair in September 2012 and similar levels were seen in the past. Despite being temporarily overrun, the line still matters, especially after working as support in November 2012.
Channel Broken to the Upside
As the chart shows in the black lines, the pair is trading in an uptrend channel since early October. Once again, this channel wasn’t enough for the pair, and it broke even higher. Could we see a mean reversion?
Another Recent Technical View: USD/JPY Advance Stalls around Key Resistance – by James Chen.
I turn from bullish to neutral on USD/JPY.
With uncertainty about the US going over the cliff or the quality of a temporary deal, the safe haven yen could enjoy some flows, despite the tough tone from Tokyo.
Further reading:
- For a broad view of all the week’s major events worldwide, read the USD outlook.
- For EUR/USD, check out the Euro to Dollar forecast.
- For GBP/USD (cable), look into the British Pound forecast.
- For the Australian dollar (Aussie), check out the AUD to USD forecast.
- For USD/CAD (loonie), check out the Canadian dollar forecast

