The New Zealand dollar shot to higher ground but eventually lost most of its gains. The upcoming week is lighter and consists only of one indicator. Nevertheless, volatility is expected to remain strong. Here is an analysis of fundamentals and an updated technical analysis for NZD/USD.
The Fed not only decided on more tapering, but Yellen also implicitly laid out a timeline for a US rate hike. This sent the USD rallying across the board and it stopped the kiwi rally. Domestic GDP didn’t help too much: the economy in New Zealand continued growing at a solid pace, 0.9% in Q4 but the downwards revision to Q3, from 1.4% to 1.2% left some mixed feelings and slowed the rally.
[do action=”autoupdate” tag=”NZDUSDUpdate”/]
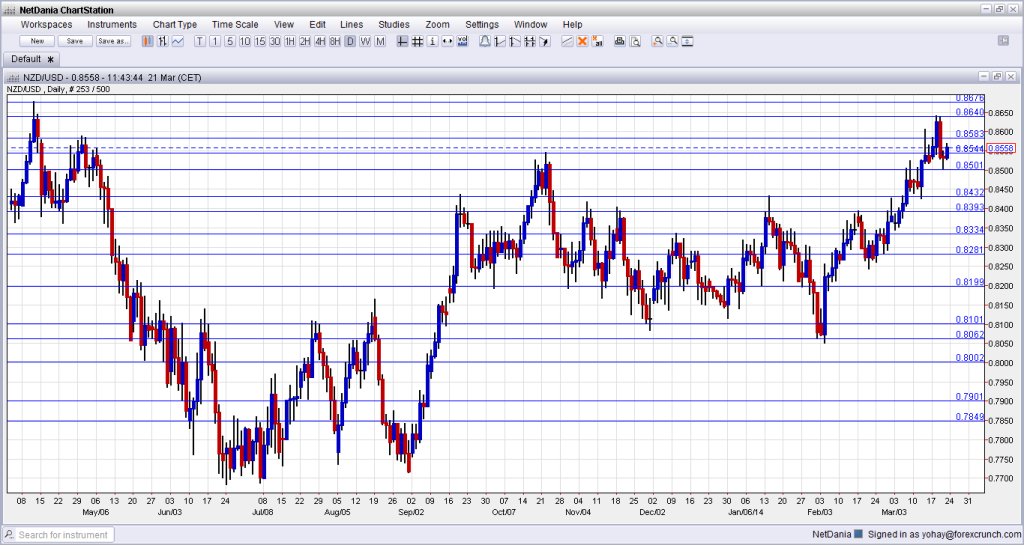
NZD/USD daily graph with support and resistance lines on it. Click to enlarge:
- Trade Balance: Wednesday, 21:45. New Zealand enjoyed 3 consecutive months of trade surpluses. In January, a better than expected read of 306 million was seen. A bigger surplus is likely now. Note that the surplus implies a positive flow for the currency.
* All times are GMT.
NZD/USD Technical Analysis
Kiwi/dollar started the week in similar levels to those seen last week, in the mid 0.85s. It then advanced and marked a double top at 0.8640. A downfall followed and the pair found perfect support at 0.85 before staging a recovery.
Technical lines, from top to bottom:
The 2013 peak of 0.8676 is a strong line in the distance. The 2014 peak of 0.8640 is close by, and it is key to any upside moves.
It is followed by the stubborn May 2013 high of 0.8586 is another important line. The October peak of 0.8544 is an important resistance line.
0.85 is around number and could trigger comments by policymakers. A move above this line didn’t hold in early March 2014. 0.8435 was the peak in September and was retested in January. It is a strong double top.
0.8392 served as resistance was a recurring peak between November and February. 0.8335 capped a move higher in December and also had a role in the past. The pair fell short of this line in January 2014.
Below, 0.8280 supported the pair in February 2014 and also in the past. 0.82, worked as support several times: in September, October and also in December. It is somewhat weaker now.
Close by, 0.8150 capped the pair in August and worked as support in March. 0.8060 provided support to the pair in January 2014 and is the level to watch.
The round number of 0.80 doesn’t have a technical significance, but is certainly psychologically important.
I remain bullish on NZD/USD
The impressive way in which the kiwi managed to end another week higher despite a US dollar storm across the board is telling: the tightening cycle in New Zealand has already begun. Even if the US is getting closer to its own real tightening (and not only slower loosening), the advantage that New Zealand has in this round can certainly be reflected for another week.
Further reading:
- For a broad view of all the week’s major events worldwide, read the USD outlook.
- For EUR/USD, check out the Euro to Dollar forecast.
- For the Japanese yen, read the USD/JPY forecast.
- For GBP/USD (cable), look into the British Pound forecast.
- For the Australian dollar (Aussie), check out the AUD to USD forecast.
- For USD/CAD (loonie), check out the Canadian dollar forecast.
