GBP/USD lost 80 points on the week, as the pair closed at 1.6752. This week’s highlights are the PMI releases. Here is an outlook for the main events moving the pound, and an updated technical analysis for GBP/USD.
US Unemployment Claims bounced back with a strong release, and consumer confidence continues to trade at high levels. However, GDP surprised the markets with a sharp contraction in Q1. In the UK, CBI Realized Sales plummeted, causing the pound to drop sharply in mid-week before partially recovering.
[do action=”autoupdate” tag=”GBPUSDUpdate”/]GBP/USD graph with support and resistance lines on it. Click to enlarge: 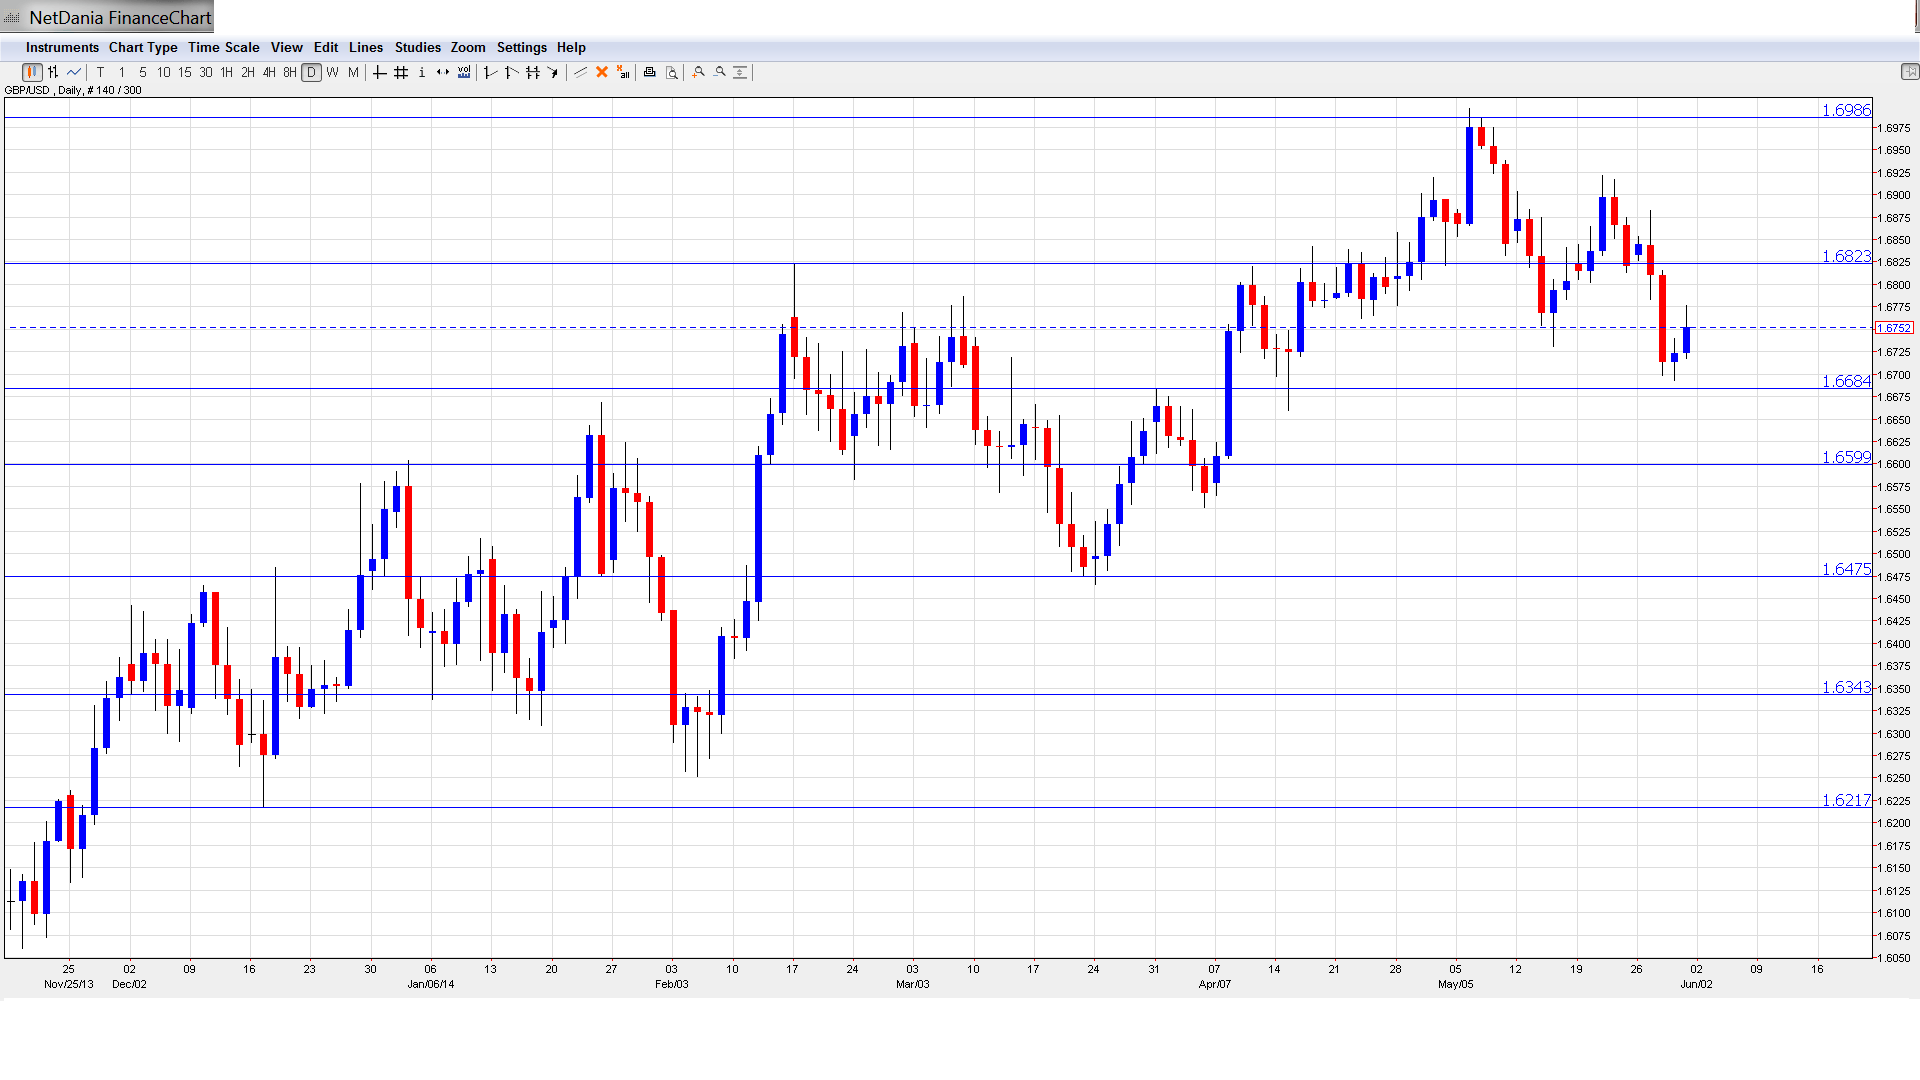
- Manufacturing PMI: Monday, 8:30. PMIs should be treated as market-movers, as any unexpected reading can have a strong impact on the direction of GBP/USD. Manufacturing PMI continues to hover in the mid-50s, pointing to expansion in the manufacturing sector. The previous release improved to 57.3 points, beating the estimate of 55.4. More of the same is expected for May, with an estimate of 57.1 points.
- Net Lending To Individuals: Monday, 8:30. This indicator is closely linked to consumer confidence and spending, as increased borrowing is indicative of consumers who are comfortable loosening the purse strings and spending. The indicator has been on an upward move, and jumped to GBP 2.9 billion in April, beating the estimate of 2.3 billion. The estimate for the upcoming release stands at 2.7 billion.
- Nationwide HPI: Tuesday, 6:00. This indicator is an important gauge of activity in the UK housing sector. The index posted a strong gain of 1.2%, marking a four-month high. This was well above the estimate of 0.6%. The markets are expecting a weaker May, with a forecast of 0.7%.
- Construction PMI: Tuesday, 8:30. Construction PMI has stayed above the 60-point level throughout 2014, pointing to strong growth in the construction sector. The previous release dipped to 60.8 points, short of the estimate of 61.2. The markets are expecting better news in the upcoming release, with an estimate of 61.2 points.
- BRC Shop Price Index: Tuesday, 23:01. This index measures the change in inflation in the BRC chain, giving analysts additional data about the level of consumer inflation in the UK. The indicator continues to post declines, with the April reading coming in at -1.4%.
- Halifax HPI: Wednesday, 4th-8th. The index has run into some turbulence, posting two straight declines. The April reading of -0.2% was well off the estimate of +0.8%. The markets are expecting a turnaround, with the May estimate standing at +0.4%.
- Services PMI: Wednesday, 8:30. This index has been fairly steady in recent readings. In April, the indicator improved to 58.7 points, surpassing the estimate of 57.9. Little change is expected, with a May estimate of 58.7 points.
- Asset Purchase Facility: Thursday, 11:00. The BOE has maintained its QE level at 375 billion for almost two years. The markets are not expecting any change in the June decision.
- Official Bank Rate: Thursday, 11:00. With the UK’s economic recovery well under way, there is increased speculation about a rate hike, although none is expected before 2015. So the BOE is expected to keep rates at the current level of 0.50%. The MPC will release a Rate Statement announcing the June rate.
- Consumer Inflation Expectations: Tuesday, 8:30. This indicator is released on a quarterly basis, magnifying the impact of each reading. The indicator continues to point to high levels, with a reading of 2.8% in Q1. Actual inflation is running slightly below the 2.0% level.
- Trade Balance: Friday, 8:30. This is one of the most important indicators and should be treated as a market-mover. It is closely linked to currency demand, as foreigners must purchase British pounds in order to buy British goods. In April, the trade deficit narrowed to GBP -8.5 billion, beating the estimate of 9.0 billion. The deficit is expected to grow in the May release, with an estimate of -8.7 billion.
* All times are GMT
GBP/USD Technical Analysis
GBP/USD opened the week at 1.6832. The pair climbed to a high of 1.6882, but then retracted and fell below the 1.67 line, touching a low of 1.6693, as support at 1.6684 (discussed last week) held firm. GBP/USD then recovered somewhat and closed the week at 1.6752.
Live chart of GBP/USD:
[do action=”tradingviews” pair=”GBPUSD” interval=”60″/]
Technical lines from top to bottom
We begin with resistance at 1.7375. This line marked the start of a sharp pound rally in March 2006, which saw the GBP/USD push above 2.11.
Next is 1.7180, which has served in a resistance since October 2008. This is followed by 1.6990, which is protecting the key psychological level of 1.70.
1.6823 continues to be busy in the month of May. The line was breached again this past week and has switched to a resistance role.
1.6684 held firm in support as the pair dropped sharply during the week. This line was an important resistance level in March and early April.
The round number of 1.6600 follows. It has remained intact since early April, which marked the start of a rally that saw the pound flirt with the 1.70 line. 1.6475 is the next support level.
1.6343 saw some activity in early February but has provided strong support since that time.
The final support line for now is 1.6217. It has held firm since last December.
I am neutral on GBP/USD.
The pound has dropped back to earth after coming close to the 1.70 level early in May. A rate hike, which would boost the pound, is unlikely before 2015. In the US, key releases have been mixed, and much will depend on this week’s Nonfarm Payrolls.
Further reading:
- For a broad view of all the week’s major events worldwide, read the USD outlook.
- For EUR/USD, check out the Euro to Dollar forecast.
- For the Japanese yen, read the USD/JPY forecast.
- For the Australian dollar (Aussie), check out the AUD to USD forecast.
